

INTRO
MATERIALS AND METHODS
Experiment I: evaluation of durum for salt tolerance
Experiment II: comparison of genetic responses of Tunisian durum cultivars
Experiment III: comparison of physiological responses of Tunisian durum cultivars
RESULTS
Experiment I: evaluation of durum for salt tolerance
Experiment II: comparison of genetic responses of two Tunisian durum cultivars
Experiment III: comparison of physiological responses of two Tunisian durum cultivars
DISCUSSION
INTRO
Soil salinity is one of the most serious abiotic stress which is inhibiting plant growth and organ development in the world (Himabindu et al., 2016). It is our perception that the region affected by salt stress is expanding (Machado&Serralheiro, 2017). Especially, in arid and semi-arid regions, crop production can be reduced by salt stress (Munns&Gilliham, 2015). Development of salt tolerant crops in cope with salt stress is significantly important for preventing an unfavorable influence on agricultural productivity (Mian et al., 2011).
Wheat (Triticum spp.) is a basic food crop for about 40% of people in the world (Li et al., 2018). Not only hexaploid wheat (AABBDD, 2n=42, T. aestivum) but also durum (AABB, 2n=28, T. turgidum L. ssp. durum) is mainly cultivated and used for production of various foods in the Mediterranean Basin and North Africa (Munns et al., 2012; Soriano et al., 2018). Tunisia is one of the countries located on this region and has three kinds of climate such as a Mediterranean, a semi-arid to arid, and a dry dessert from northern part to southern geographic region (Kim et al., 2014; Mansour&Hachicha, 2014). Soil salinity is a considerable problem in the many parts of Tunisia where durum is mainly cultivated (Brini et al., 2009; Kim et al., 2016). Therefore, the increasing problem of water shortage in the middle and southern parts of Tunisia resulted in soil salinity and reduced arable land area.
Salt tolerance is a complicated trait but includes usually three major mechanisms such as osmotic tolerance, Na+ exclusion, and tissue tolerance (Wu et al., 2015). Through the transpiration stream, Na+ accumulates in leaf blade, one of the main factors that affect to grain yield. Therefore, Na+ exclusion in shoots is a crucial factor of salt tolerance to avoid the toxicity in leaf blade by Na+ accumulation (Alqudah et al., 2018; Arabbeigi et al., 2014; Munns, 2002). The high-affinity K+ transporter (HKT) and the salt overly sensitive 1 (SOS1) are involved in accumulation of Na+ in shoots process, reduction of the long distance transport of Na+ and energy loss on Na+ exclusion, which minimize shoot damage (Munns&Tester, 2008). Many other studies have demonstrated that those genes are involved in salt tolerance and enhance the salt tolerance of wheat (Amar et al., 2014; Huang et al., 2008; Sathee et al., 2015; Wu et al., 2015).
Proline accumulates in plant cells under salt stress and exogenous proline reduces the harmful effects of salt stress (Hoque et al., 2007). Plant response to salt stress by generating antioxidants which have the ability to detoxify reactive oxygen species (ROS) that are detrimental to plant development (Ashraf, 2009). Therefore, they can be used as one of potential selection criteria of salt tolerance.
In this study, Tunisian durum cultivars were evaluated for their salt tolerance by phenotypic traits. The selected salt tolerant and susceptible cultivars were analyzed for genetic and physiological responses to salt stress. The obtained results could be applied in durum breeding for salt tolerance in arid- or semi-arid regions where soil salinity is an important problem.
MATERIALS AND METHODS
Experiment I: evaluation of durum for salt tolerance
Plant materials and experimental conditions
Eleven Tunisian durum cultivars were evaluated for salt tolerance (Table 1). The seeds were kindly provided by the National Plant Germplasm System (NPGS), United States Department of Agriculture (USDA/ARS). The basic agronomic information on each cultivar was collected from the Agricultural Research Service-Germplasm Resources Information Network (ARS-GRIN) (https://npgsweb.ars-grin.gov/).
Table 1. Durum cultivars used to evaluate salt tolerance.
The salt tolerance of each cultivar was evaluated in a greenhouse at Korea University’s Research Farm (Namyangju- si, Gyeonggi-do, Korea) during the 2014 growing season. Seeds were germinated at 4°C for 2 weeks and each plant was transplanted to a pot (5×8 / 5 cm×5 cm×16 cm height) filled with soil (50 g dry weight; Sunshine mix #1, Sun Gro Horticulture, Canada). Five plants from each cultivar was allocated to either the non-treated control or treated group. All plants were grown with sufficient irrigation until the beginning of the salt treatment. At the fully expanded 3rd leaf stage (Zadok scale 13), plants in the treated group were subjected to salt stress by submerging the pots in 500 mM NaCl solution for 5 min every 2 days. Plants in the non-treated control received normal water every 2 days. The treatment was applied for 2 weeks. After the treatment, all plants were given sufficient water and grown until spike harvest.
Electrical conductivity (EC) of the soil was measured at the start and the end of treatment using a Direct Soil Activity and Solution Conductivity Measurement Kit (HI 993310, Hanna Instruments, Woonsocket, RI, USA) with a stainless EC probe (HI 76305, Hanna Instruments, Woonsocket, RI, USA). EC of soils in both control and treatment conditions were measured as 0.35±0.09 dS/m at the start of the treatment, whereas at the end of the treatment, those in control condition and in treatment condition were measured as 0.54±0.15 dS/m and 10.24±0.85 dS/m, respectively.
The phenotypic parameters such as plant height, average leaf length, number of tillers, and leaf chlorophyll content were scored at the beginning and end of treatment.
Leaf chlorophyll content was estimated by using a portable chlorophyll meter (SPAD-502, Minolta, Japan) which can determine leaf chlorophyll content quickly without damaging leaves (Yıldırım et al., 2010). The salt tolerance trait index (STTI) and salt tolerance index (STI) were computed with the formula used in the previous other studies (Ali et al., 2007; Kim et al., 2016; Shahzad et al., 2012).
| $$\begin{array}{l}STTI=\frac{Value\;of\;trait\;under\;treatment\;condition}{Value\;of\;trait\;under\;control\;condition}\times100\\\\STI=The\;mean\;of\;STTIs\end{array}$$ |
Eleven durum cultivars were identified as either tolerant or sensitive to salt stress based on STI. One sensitive cultivar ‘Mahmoudi’ was selected and used for further analysis comparing with another Tunisian durum cultivar ‘Om Rabia’, which is known for salt-tolerant (provided by Centre of Biotechnology of Sfax, Sfax, Tunisia). ‘Om Rabia’ is considered as salt-tolerant durum cultivar (Amar et al., 2014; Khoufi et al., 2012).
Experiment II: comparison of genetic responses of Tunisian durum cultivars
Plant materials and experimental conditions
The second experiment using two tolerant and susceptible Tunisian durum cultivars was conducted as previous method with some minor modification. The salt-stress treatment was applied for 1 week and the phenotypic parameters such as plant height and leaf chlorophyll content were scored at the beginning and end of treatment. Shoots of each plant from both non-treated and treated groups at the beginning and the end of treatment were sampled to analyze the gene expression.
Gene expression analysis
RNA (ribonucleic acid) was extracted from shoots using the Trizol method. The first strand cDNA was synthesized with the Power cDNA Synthesis Kit (Intron Biotechnology, Seoul, Korea) following the manufacturer’s protocol. The qPCR using the genes associated with the salt tolerance was performed (Table 2).
Table 2. Primers used in the qPCR analysis.
Experiment III: comparison of physiological responses of Tunisian durum cultivars
Plant materials and experimental conditions
Two Tunisian durum cultivars (‘Om Rabia’ and ‘Mahmoudi’) were also used in the third experiment. Seeds were germinated at 4°C for 2 weeks and each plant was transplanted to the magenta boxes containing 1000-fold diluted Hyponex solution (Type: 6-10-5, Hyponex, Japan). Ten plants in each magenta box were grown with refreshing Hyponex solution every day until the beginning of the salt treatment. At the fully expanded 3rd leaf stage (Zadok scale 13), plants were subjected to salt stress by changing the solution to the saline solution (150 mM NaCl). The saline solution was renewed every day and the salt-stress treatment was applied for 48 hours. Leaf blades of each cultivar were sampled at both the beginning and the end of the treatment.
Crude protein/enzyme extraction
Crude protein/enzyme extraction was carried out according to Chen&Zhang (2016) with some modifications. Leaf blades were grinded with mortar and pestle in liquid nitrogen. The leaf powder (0.1 g) were homogenized in 1.5 ml of 100 mM sodium phosphate buffer (PBS, pH 7.8) on ice and centrifuged at 14,000 rpm for 20 min at 4°C. The supernatant was 10-fold diluted with 100mM PBS (pH 7.8) and used to measurement of proline content and Superoxide dismutase (SOD) activity.
Proline content measurement
The proline content was measured according to Chen&Zhang (2016) with some modifications. 50 µl of 10-fold diluted crude protein/enzyme extract was mixed with 1 ml of the reaction solution which contains 0.25 ml of 3% sulphosalicylic acid, 0.25 ml of glacial acetic acid, and 0.5 ml of 2.5% acid-ninhydrin. The reaction mixture was boiled for 15 min and cool down on ice for 5 min. The absorbance was recorded at 520 nm. A standard curve of known concentrations of L-proline was applied to determine the proline content in samples. The results were calculated as μg/g FW (Fresh weight).
Superoxide dismutase (SOD) activity analysis
SOD activity was analyzed according to Chen&Zhang (2016) with some modifications. 180 µl of 10-fold diluted crude protein/enzyme extract was mixed with 20 µl of the reaction solution which contains 2 µl of 1 mM EDTA- 2Na, 6 µl of 130 mM methionine, 6 µl of 750 µM nitroblue tetrazolium (NBT), and 6 µl of 20 µM riboflavin. The activity of SOD was analyzed by evaluating its ability to inhibit photochemical reduction of NBT at 560 nm.
RESULTS
Experiment I: evaluation of durum for salt tolerance
The magnitudes of plant growth parameters of plants in both control and treatment conditions were evaluated at the initiation and end of salt stress. After 14 days of salt treatment, plants in treatment condition showed decreased plant height, average leaf length, number of tillers, and leaf chlorophyll contents compared to those in control condition (Supplementary Table 1). ‘Mahmoudi (PI306573)’ showed the lowest STI (66.5%) whereas ‘Magrhrebi 72’ (PI 433758) showed the highest STI (90.6%) (Table 1).
Experiment II: comparison of genetic responses of two Tunisian durum cultivars
Both ‘Om Rabia’ and ‘Mahmoudi’ under salt stress condition showed reduced plant height compared to those in control condition after 7 days of salt treatment (Fig. 1). However, the difference of plant heights of ‘Mahmoudi’ between control and treatment conditions was larger than that of ‘Om Rabia’. Leaf chlorophyll contents in both cultivars were decreased after salt treatment (Fig. 2). ‘Mahmoudi’ showed much more reduction of leaf chlorophyll content than ‘Om Rabia’, which is in accordance with the result of plant height. After calculating STTI and STI, ‘Om Rabia’ showed higher STTI and STI than ‘Mahmoudi’ (Fig. 3). These results indicated that ‘Om Rabia’ is more tolerant to salt stress than ‘Mahmoudi’
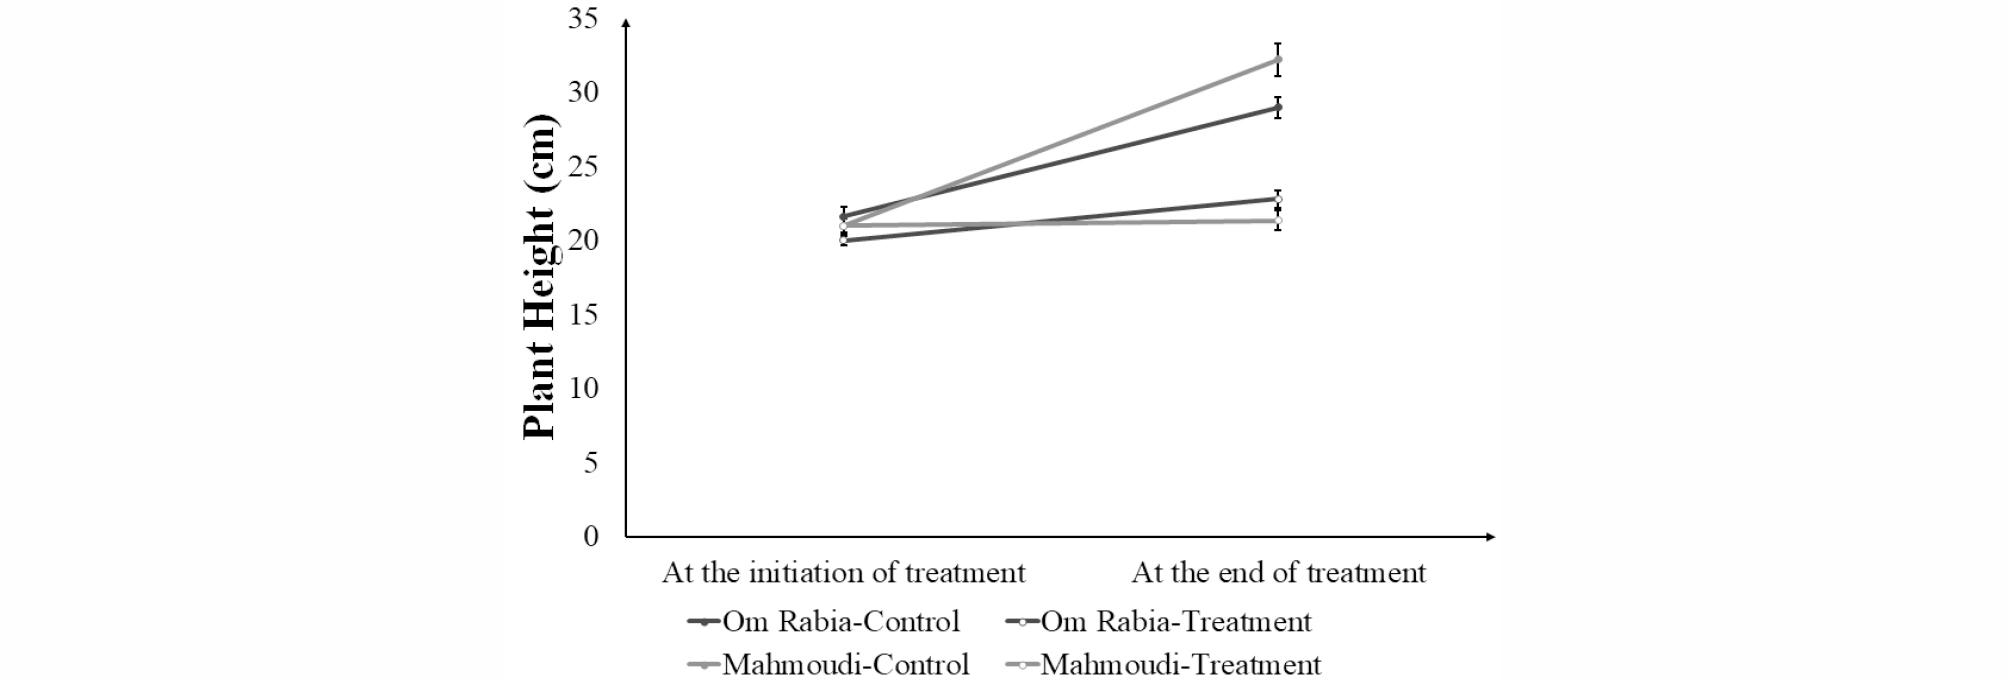
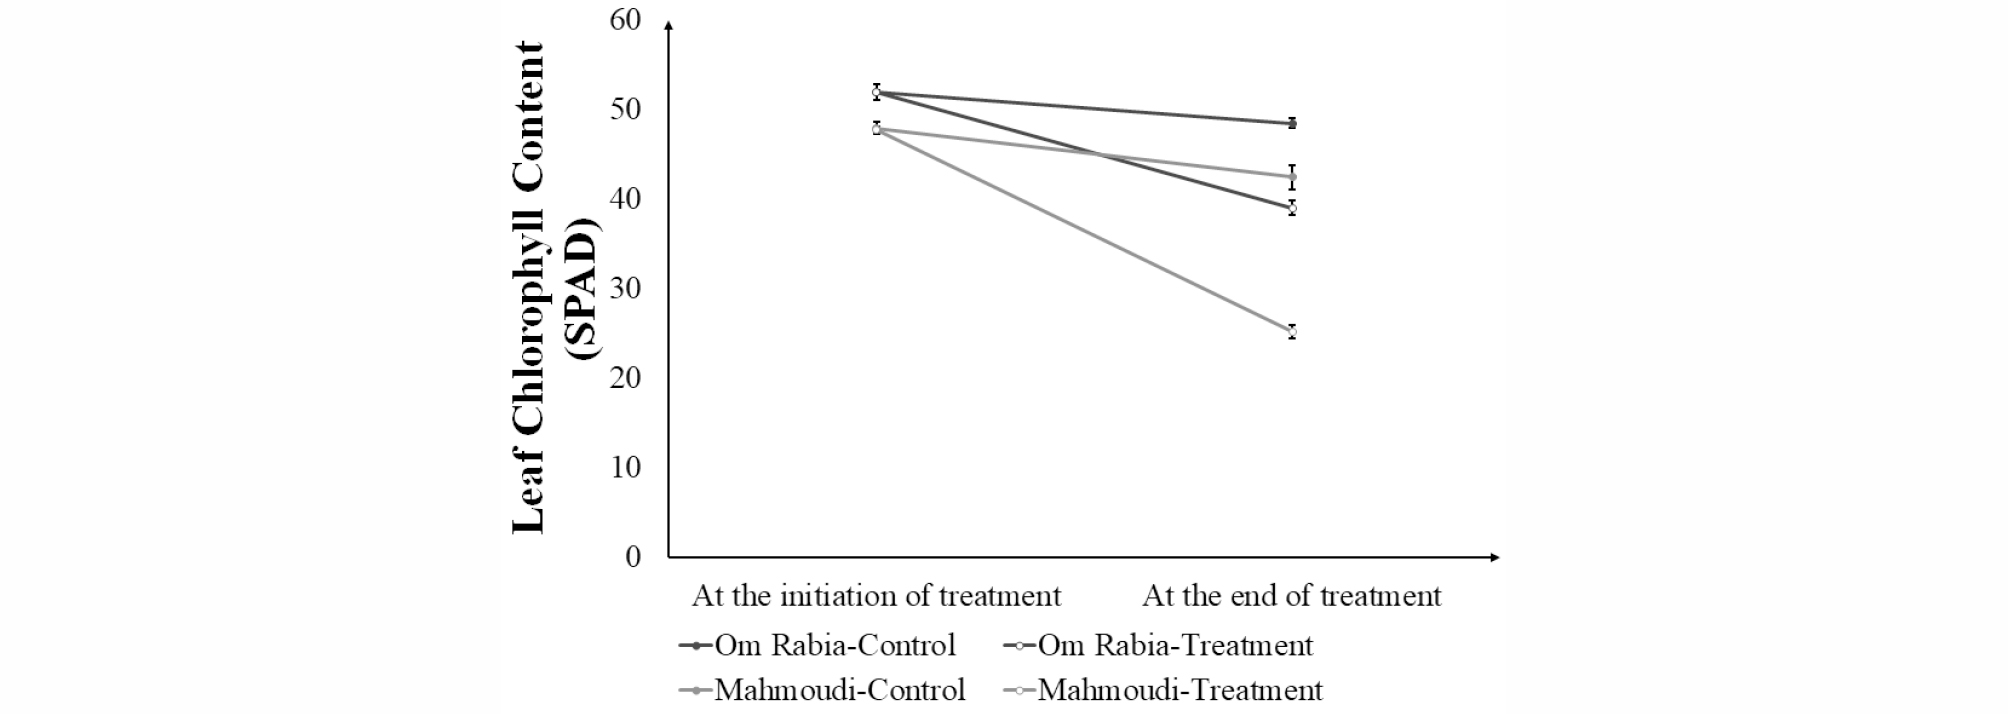
Fig. 2.
Average leaf chlorophyll contents of ‘Om Rabia’ and ‘Mahmoudi’ after 7 days of salt treatment. The values are means (±SE) of five biological replicates. Closed symbols indicate plants grown under control conditions and open symbols indicate plants grown under salt stress (treatment) conditions.
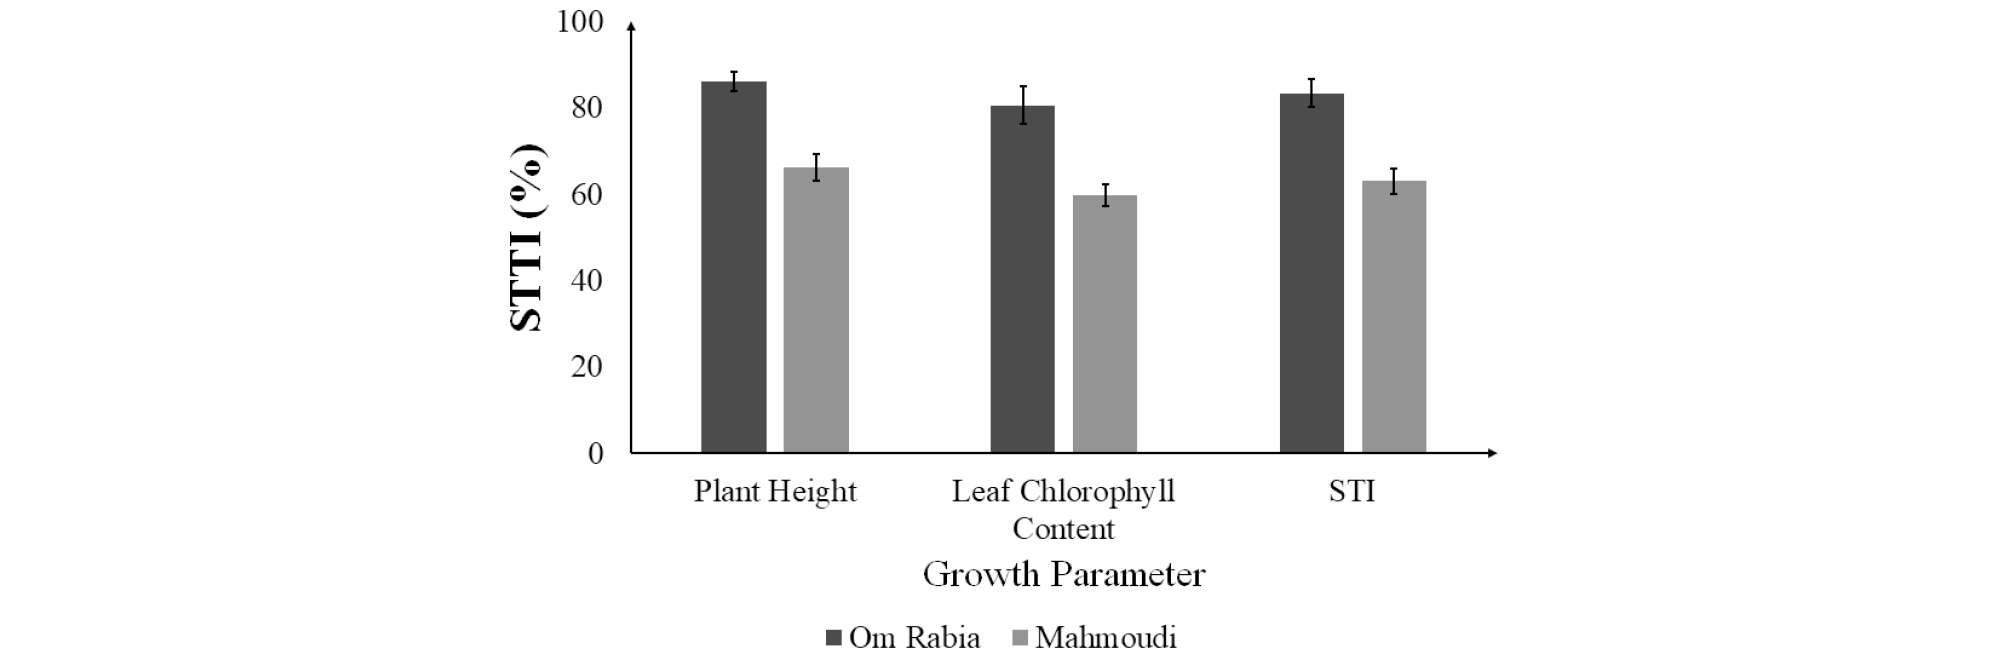
Fig. 3.
Average leaf chlorophyll contents of ‘Om Rabia’ and ‘Mahmoudi’ after 7 days of salt treatment. The values are means (±SE) of five biological replicates. Closed symbols indicate plants grown under control conditions and open symbols indicate plants grown under salt stress (treatment) conditions.
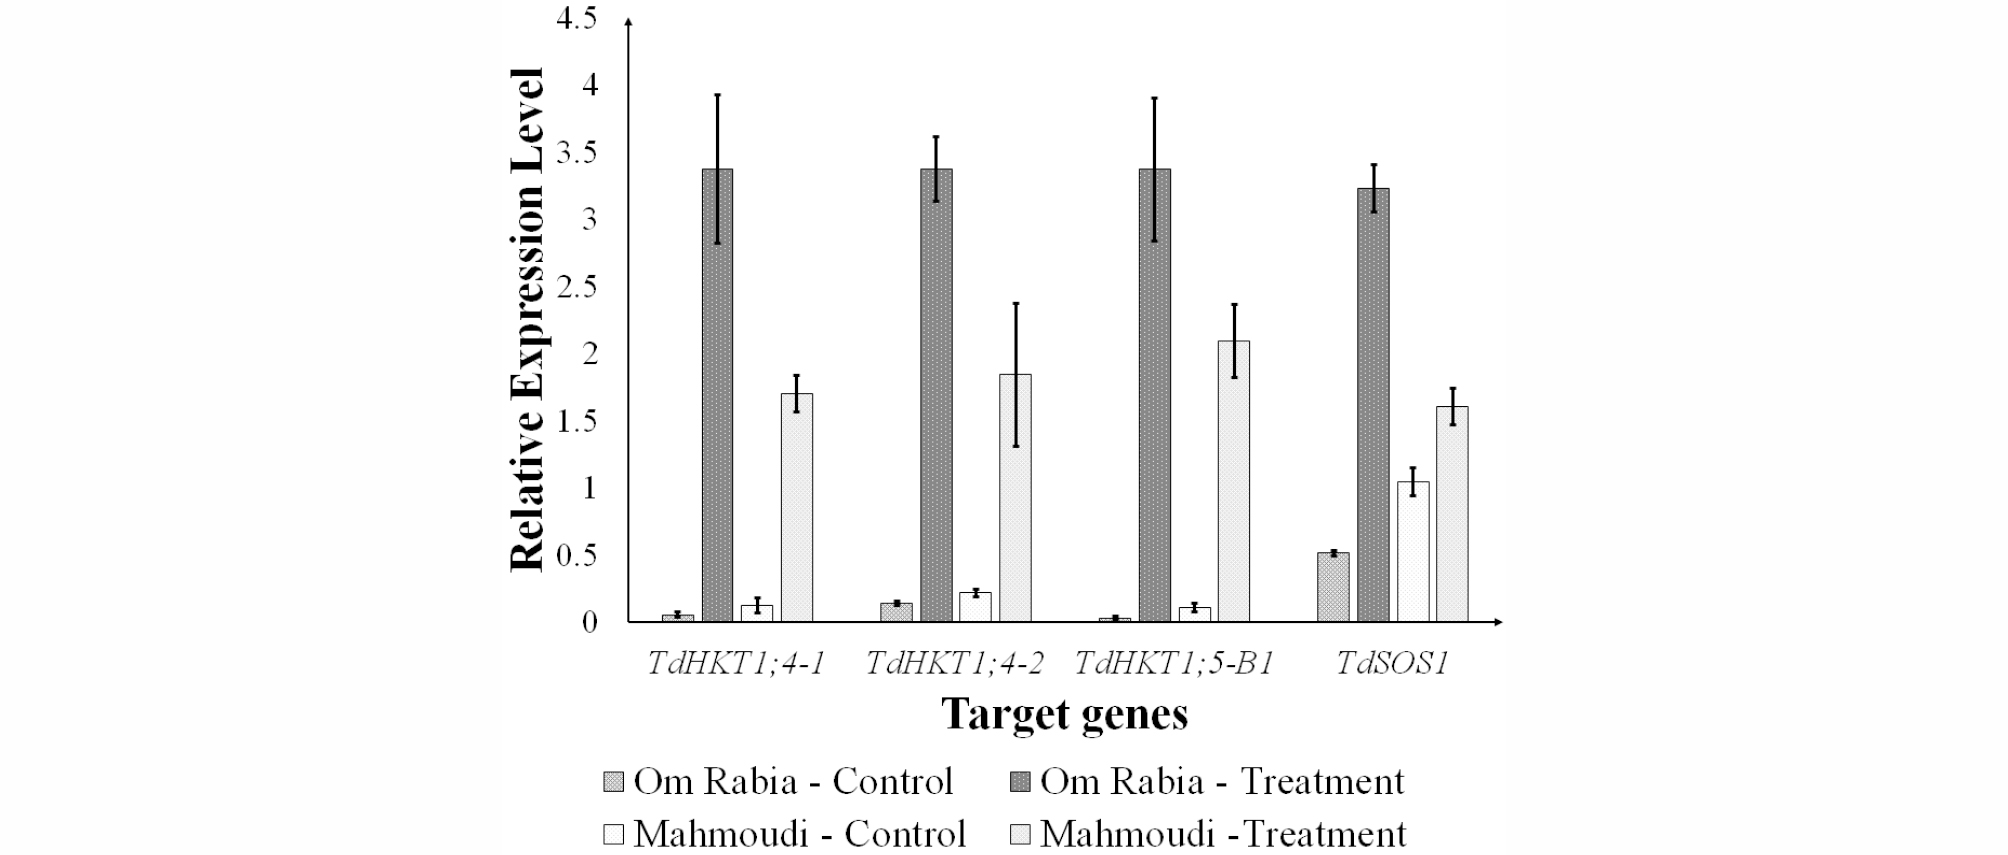
The transcription levels of the genes associated with salt tolerance were analyzed by qPCR (Fig. 4). Both cultivars showed low expression levels in control condition but high expression levels in treatment condition. In the treatment condition, ‘Om Rabia’ showed significantly higher expression levels than ‘Mahmoudi’, which resulted in greater expression differences in ‘Om Rabia’ than ‘Mahmoudi’ between control and treatment condition.
Experiment III: comparison of physiological responses of two Tunisian durum cultivars
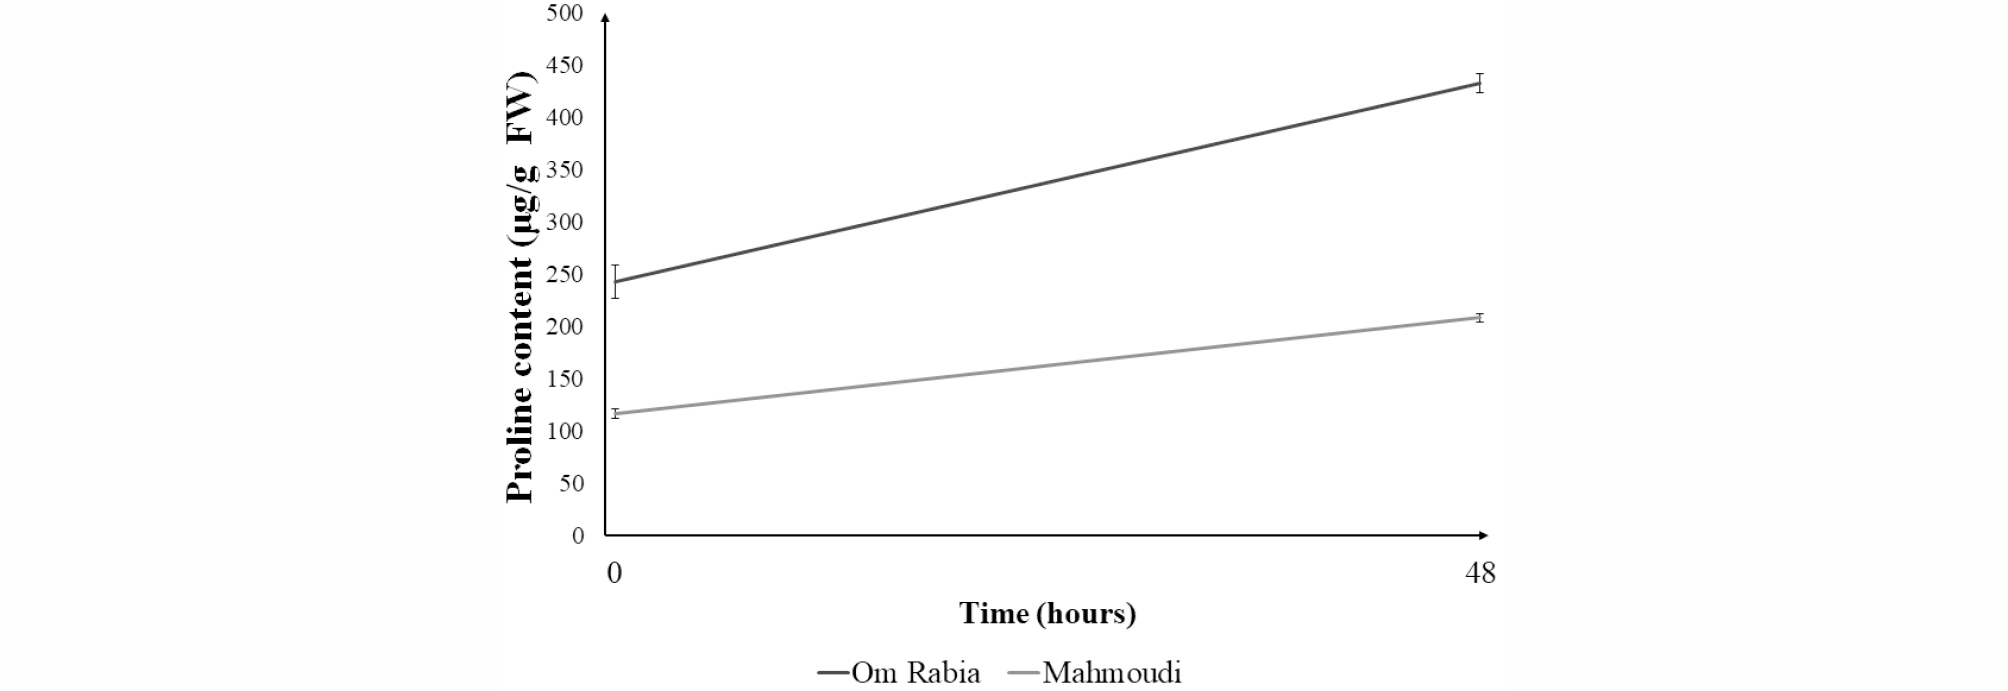
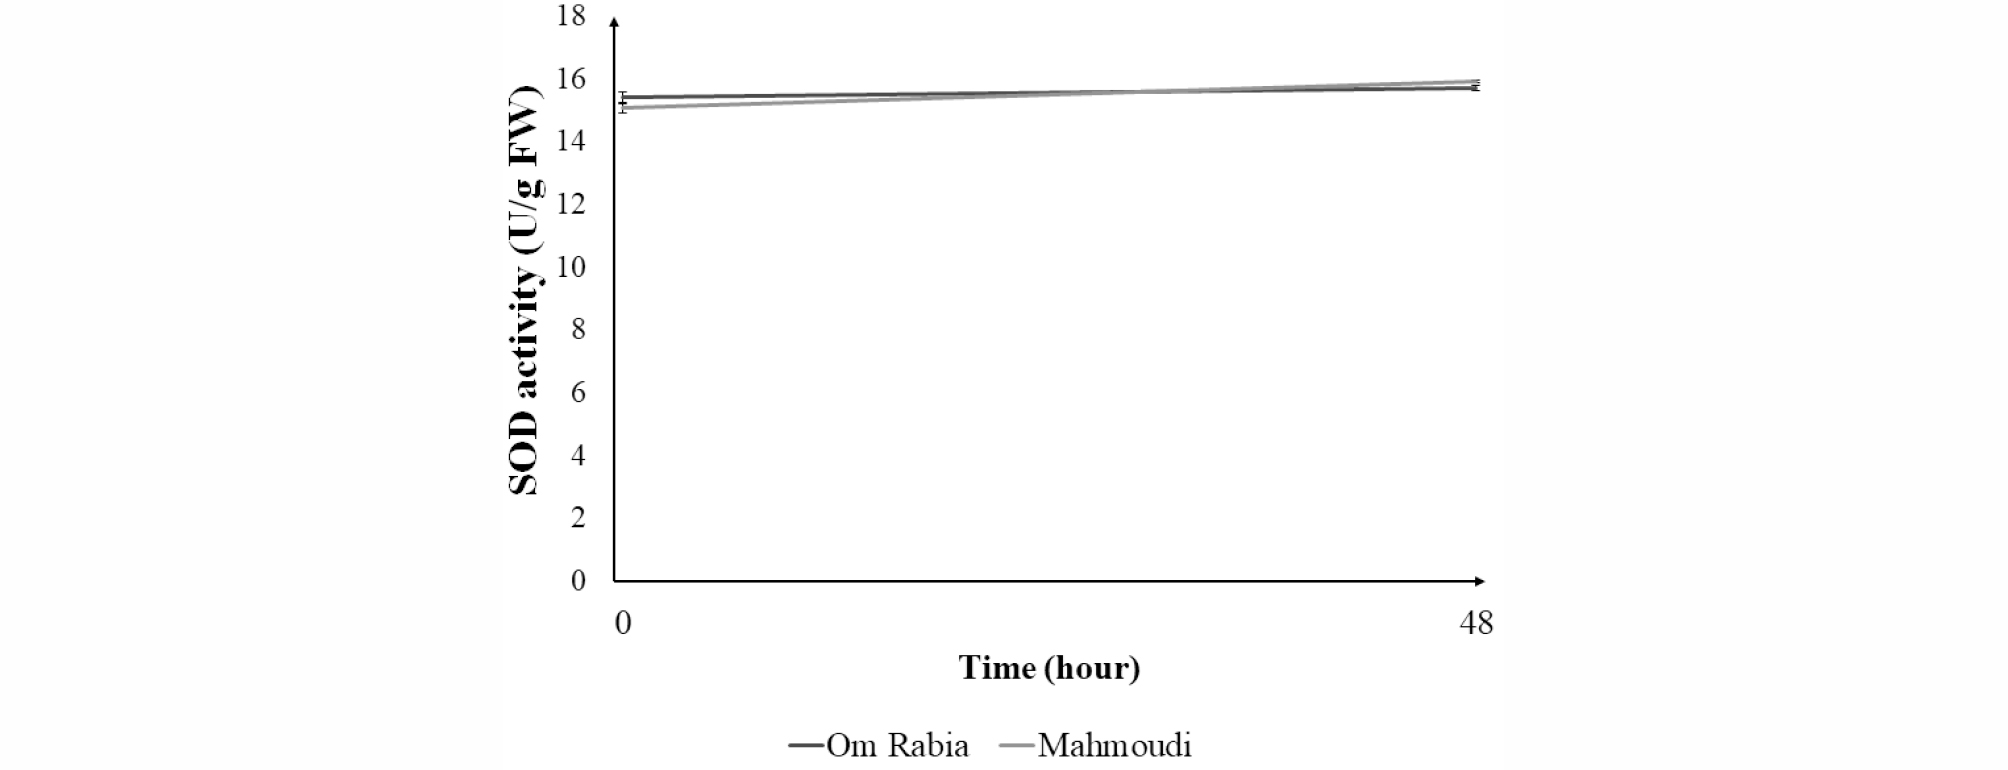
After 48 hours of salt stress treatment, proline contents in leaf blade were increased in both ‘Om Rabia’ and ‘Mahmoudi’ (Fig. 5). Furthermore, the proline content of ‘Om Rabia’ was increased more compared to that of ‘Mahmoudi’. There was no significant difference in SOD activities in leaf blades between initiation and end of salt treatment (Fig. 6).
DISCUSSION
Some of the physiological and phenotypic parameters were reduced in their magnitudes under the salt stress. Shafi et al. (2009) indicated that chlorophyll content of leaf and plant height were reduced under salt stress compared with non-stressed condition. Also, both tiller numbers and leaf length were decreased under salt stress (El-Hendawy et al., 2005; Saqib et al., 2012). Within these parameters, chlorophyll content of leaf is considered as more critical indicator to salt stress susceptibility/ tolerance than other parameters (Kim et al., 2016). Therefore, evaluation of salt tolerance based on the STI of these parameters is a valid method that it can be utilized in breeding programs
The transcription levels of the genes, TdHKT1;4, TdHKT1;5, and TdSOS1 were analyzed by qPCR (Fig. 4). Those genes are associated with accumulation process of Na+ in shoots and lessen the impairment in shoot (Munns&Tester, 2008). James et al. (2011) identified that the salt tolerance of common wheat was improved by the introgression of HKT1;4 and HKT1;5 genes from T. monococcum into common wheat. Cotsaftis et al. (2012) reported that higher expressions of HKT1;4, involved in sheath to blade transfer of Na+, and HKT1;5, involved in root to shoot transfer of Na+, can protect the photosynthetic part of shoot in rice. Overexpression of SOS1 in Arabidopsis showed enhanced salt tolerance (Shi et al., 2003). Thus, the accessions that have higher expression levels of those genes can have more tolerance to salt stress.
Proline contents in leaf blade were increased in both cultivars but the salt-tolerant cultivar ‘Om Rabia’ showed more increased content compared to that of susceptible ‘Mahmoudi’. Hoque et al. (2007) reported that proline accumulates in plant cells under salt stress and exogenous proline reduces the detrimental effects of salt stress. Therefore, the accessions, which can produce much more proline under salt stress, could be used as crossing materials to develop the salt tolerant cultivars.
Sairam et al. (2005) reported that salt-tolerant cultivars displayed higher increment in SOD. However, in this study, there was no significant difference of SOD in leaf blade between both cultivars after 48 hours of salt-stress treatment. The severity and duration of stress as well as cultivar difference should be associated with SOD activity.
In this study, Tunisian durum cultivars were evaluated for their salt tolerance. Also, genetic and physiological responses of either tolerance or susceptible cultivars to salt stress were analyzed. Most of obtained results were in accordance with other previous studies, which suggest the future direction to develop salt-tolerant durum cultivars. The results acquired in this study might enhance breeding programs for salt tolerance in durum.
