

Introduction
MATERIALS AND METHODS
Experimental field and growth chamber tests
Investigation of agricultural performance and climatic conditions
Analysis of genetic relationships
Statistical analysis
RESULTS
Correlation between climatic conditions
Correlations between agricultural performance traits
Correlations between climatic conditions and agricultural performance traits
Complementary data
DISCUSSION
Effect of climatic conditions and genetic characteristics on flowering and maturity
Effect of climatic conditions and genetic characteristics on stem length
Effect of climatic conditions and genetic characteristics on yield components
Introduction
Variability in climatic conditions such as DL, AVT, accumulated temperature (ACCT), and precipitation (PRC) is a major fluctuating factor in estimates of crop development. Although the influence of climate on crops depends on geographic location and production conditions (Thompson, 1969), interactions between genetic characteristics and climatic conditions including AVT and PRC also affect the agricultural performance of crops (Hofstrand, 2011). Climatic conditions are consistently changing in Northeast Asia, which is well known as a native geographic range for soybean production. Agronomic scientists and farmers have had to change their crop management practices and adapt their crops to these changing conditions. As is evident from former studies, crop genetics that interact with climate changes have been changed due to breeding efforts and genetic engineering.
Numerous researchers have confirmed that climate is also closely related to the agricultural performance of soybean (Thompson, 1969; Frederick et al., 2001; Kumar et al., 2008). Soybean is a short-day plant and requires a certain DL during its developmental time, including flowering (Garner & Allard, 1930; Hadley et al., 1984). Despite the same soybean, it has been observed that flowering time varies with environmental conditions (Kumar et al., 2008; Park et al., 2016). For the first time, Garner & Allard (1930) proposed an interactive effect of DL and temperature on soybean floral development, indicating that flowering of soybean is controlled by both photoperiod and temperature.
In addition, water deficiency in soybean fields reduces the efficiency of photosynthesis (Berlato, 1981), leaf area, crop growth rate, shoot dry matter (Pandey et al., 1984), number of pods, seeds per pod (Cox & Jolliff, 1986), number of flowers during the flowering period, and seed weight during the grain filling stage (Fageria, 1989). Of the yield components, the number of pods is the most sensitive to drought stress while seed weight is least affected (Meckel et al., 1984). A previous study reported that increased temperature resulted in increased soybean plant height and number of nodes (Van Schaik & Probst, 1958).
However, along with climatic conditions, genotypic performance generally controls the potential and risk associated with crop production. Genotyping is one of the processes used to confirm differences in the genotypic performances of individual plants. It has been reported that DTF and DTM in soybean are controlled by seven major loci with two alleles at each locus: E1 and E2 (Bernard, 1971), E3 (Buzzell, 1971), E4 (Buzzell & Voldeng, 1980), E5 (McBlain & Bernard, 1987), E6 (Bonato & Vello, 1999), E7 (12Cober & Voldeng, 2001), E8 (Cober et al., 2010), and a determinate growth habit locus (Dt1) (Thompson et al., 1997). Major genes and quantitative trait loci (QTLs) are closely associated with each other in the flowering interaction that controls time to flowering (Watanabe et al., 2012). Consequently, DTF is influenced by a combination of genes and QTLs. Previous studies demonstrated that the Dt1 locus plays an essential role in soybean determinate growth. Stem termination has also been observed to be significantly related to stem length and maturity of soybean (Bernard, 1972), indicating that plant height and maturity might share a similar genetic locus (Zhang et al., 2004; Lee et al., 1996). To examine the genetic characteristics of soybean, many researchers have identified major genes and QTLs controlling agronomic traits including maturity (Watanabe et al., 2009) and plant height (Zhang et al., 2018) using map-based cloning. Simple sequence repeat (SSR)—an effective genetic marker with various applications—is one of the most favored molecular markers for plant genotyping owing to its high polymorphism (Mason, 2015). Genetic diversity and the genotype of soybeans were also recently analyzed using SSR markers (Zhang et al., 2013; Bisen et al., 2015; Hipparagi et al., 2017).
Several experimental field studies have been performed to analyze the interactions between climatic conditions and the genetic characteristics of soybean. In addition, greenhouse and growth chamber tests were conducted to investigate the responses of soybeans to the timing and severity of climatic conditions (e.g., water and temperature stresses), and to complement the results of field studies (Hollinger & Changnon, 1993; Avila et al., 2013). These investigations were geared toward understanding the characteristics of soybeans by examining the effects of climatic conditions and/or genetic characteristics on agricultural performance. However, the interactions between the genetic characteristics of soybean and climatic conditions require further assessment. Therefore, the goal of this study was to evaluate the interactions between climatic conditions and genetic characteristics to strengthen soybean management and contribute to the development of new varieties that can adapt to climate changes in Northeast Asia. We conducted experimental field tests at six locations in China and the Republic of Korea, which had diverse climatic conditions. Growth chamber tests under six combinations of temperature and DL were conducted, and a genetic tree was constructed using SSR markers that are significantly associated with each agronomic trait of soybean.
MATERIALS AND METHODS
Experimental field and growth chamber tests
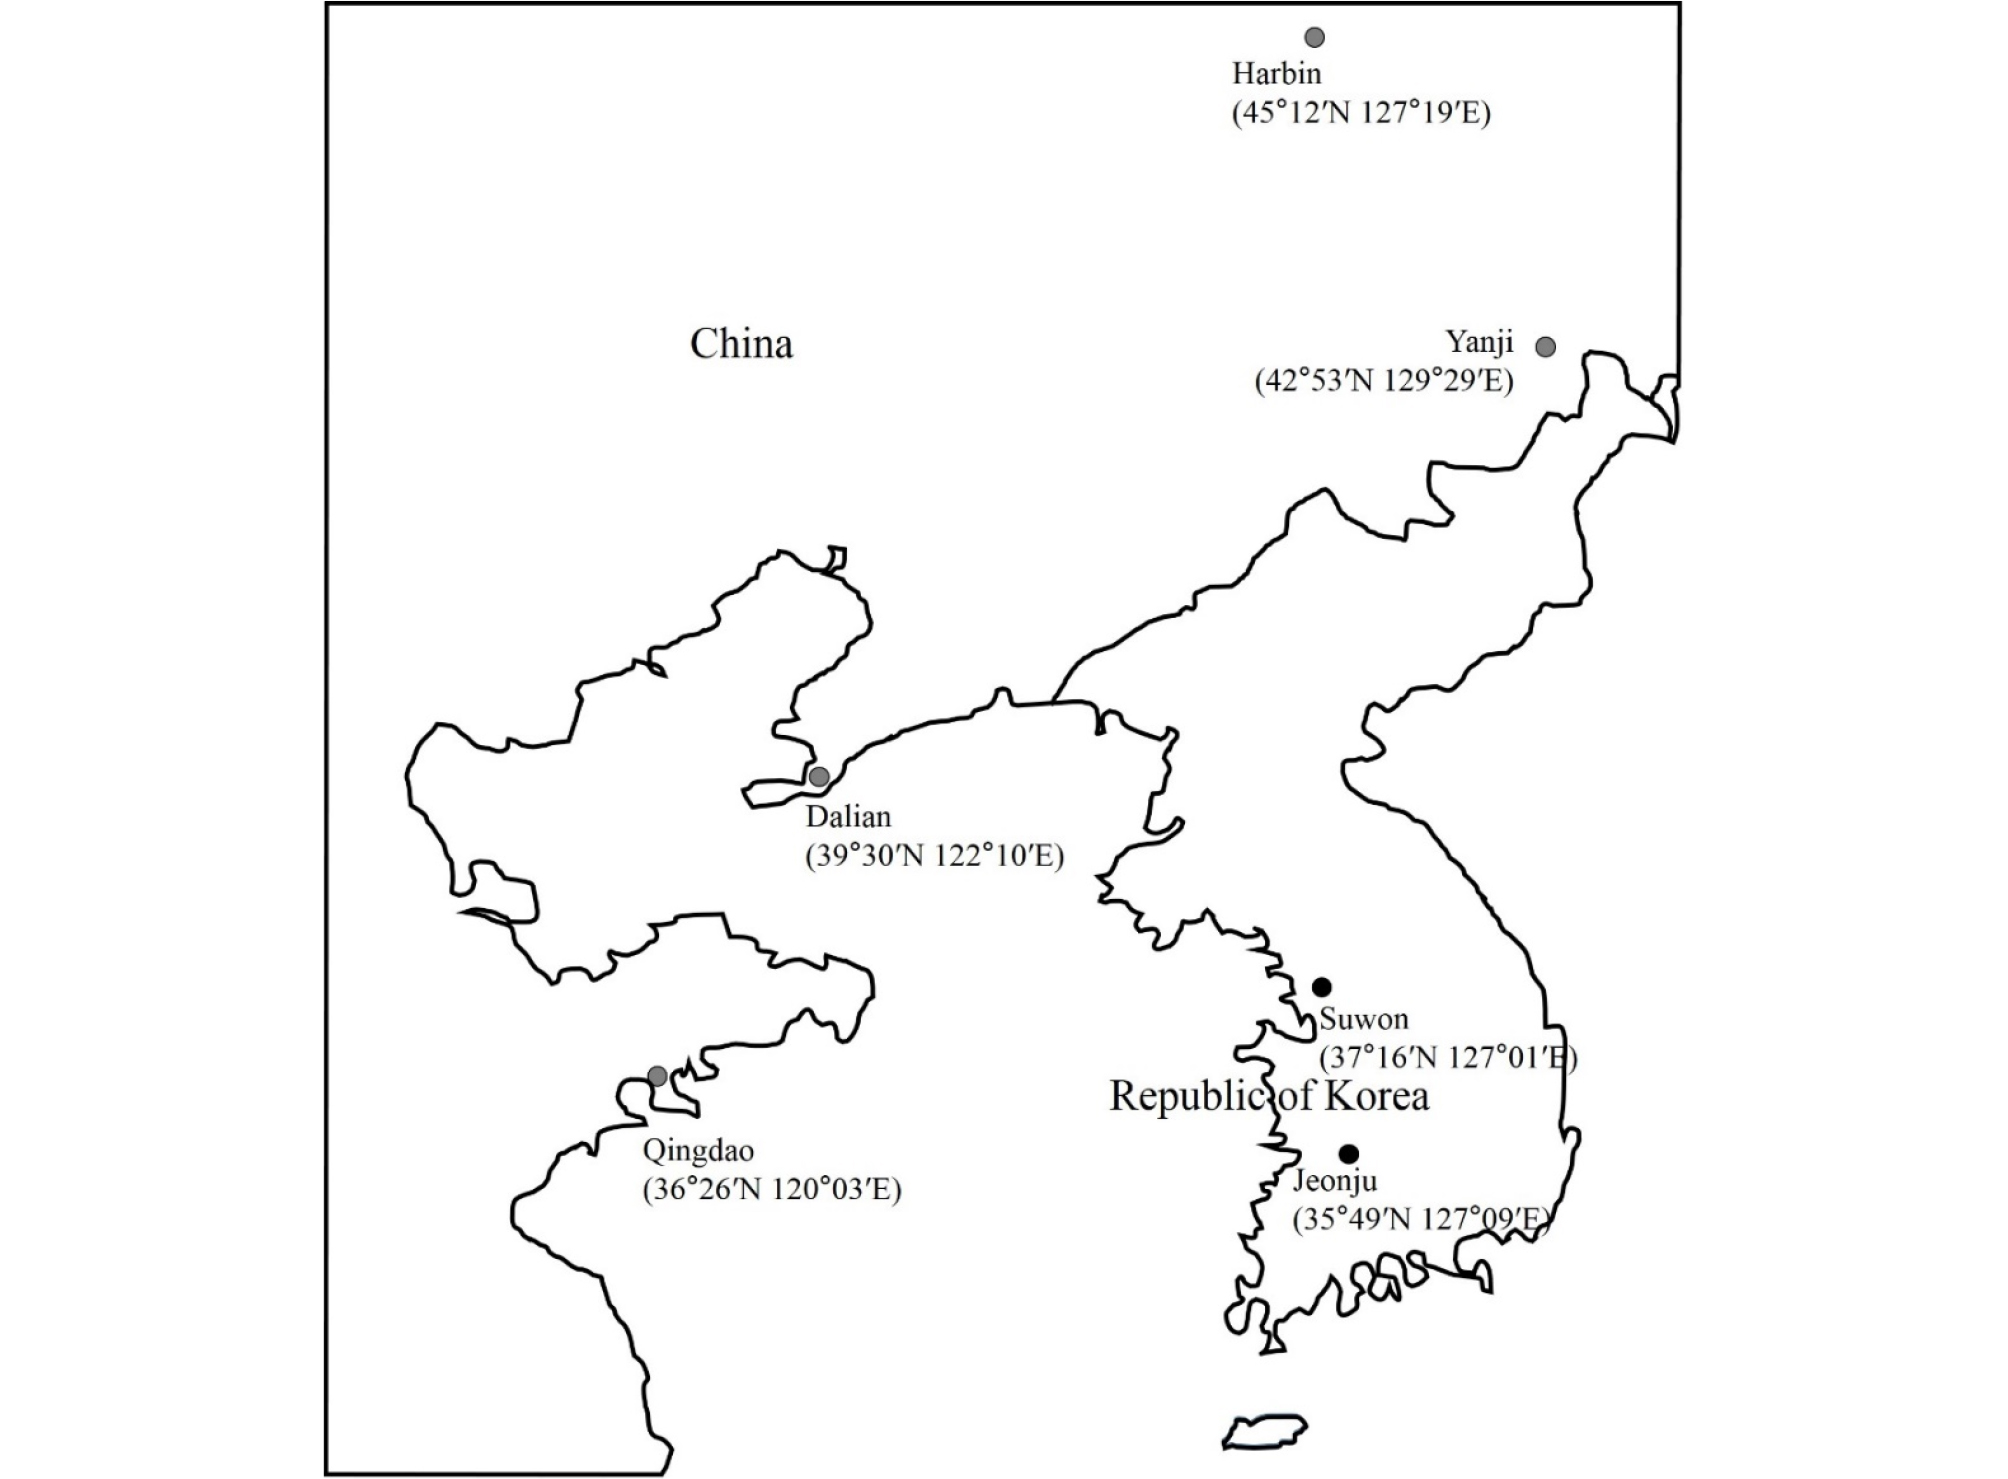
We conducted preliminary tests in 2014 and 2015 to select soybean varieties/lines and experimental test fields. We selected 11 varieties/lines with diverse DTF (‘Hannamkong’, ‘Keumgangkong’, ‘Tawonkong’, ‘Duyoukong’, L62-667, OT93- 28, OT89-5, OT94-37, OT89-6, OT94-39, and OT94-51) and six experimental fields in China [Harbin (45°12N, 127°19E), Yanji (42°53N, 129°29E), Dalian (39°30N, 122°10E), and Qingdao (36°26N, 120°03E)] and the Republic of Korea [Suwon (37°16N, 127°01E) and Jeonju (35°49N, 127°09E)] (Fig. 1). The experimental plots were completely randomized with four replicates by experimental fields for this study. In 2016 and 2017, we sowed soybean seeds in the middle of May (Harbin: May 9th, 2016 and May 8th, 2017; Yanji: May 9th, 2016 and May 8th, 2017; Dalian: May 14th, 2016 and May 14th, 2017) and harvested in the middle of October for the northern sites, and sowed in the middle of June (Suwon: June 9th, 2016 and, June 8th, 2017; Qingdao: June 22nd, 2016 and June 14th, 2017; Jeonju: June 20th, 2016 and June 8th, 2017) and harvested in early October for the southern sites. The seeds were sown in 70 × 15 cm plots spacing in plots of the six experimental fields and were treated with a basic granular fertilizer of N:P2O5:K2O = 40:70:60 kg/ha before sowing.
To complement the results of the field tests, the DTF and STL of soybeans grown in walk-in chambers (Koito Manufacturing Co., Ltd., Tokyo, Japan) were investigated. We selected four soybeans based on their DTF investigated in the field: ‘Hannamkong’, ‘Tawonkong’, OT93-28, and OT89-5. The chambers were controlled with six combinations of AVTs (18, 23,and 28°C) and DLs (10 and 15 h) under a fixed relative humidity of 65% from sowing to harvesting. For this experiment, arrangement of pots in each chamber was completely randomized with five replicates by varieties. Each pot was composed of three plants.
Investigation of agricultural performance and climatic conditions
Agronomic traits related to soybean growth and yield were measured according to the agricultural science technology standards for investigation of research of the Rural Development Administration (RDA), Republic of Korea (RDA, 2012). These include: 1) DTF, defined as the days to the first bloom on the main stem after sowing (R1); 2) Days to maturity (DTM), defined as the days from R1 to full maturity (95% of the pods reach a mature pod color; stage R8); 3) 100-seed weight (HSW), defined as the weight of 100 seeds measured under 13% moisture content; 4) STL, defined as the length from the cotyledonary node to the top of the main stem; and 5) YLD (kg/10 a), calculated as the total weight (kg) of seeds harvested in 1 m2 × 1000.
Regional climatic conditions—including DL, AVT, ACCT, and PRC—at the test fields during the growth period of the soybeans were investigated using weather data obtained from the Chinese Meteorological Administration and the Korean Meteorological Administration. We examined the data for each climatic element by month, then classified the data largely into two soybean growth periods: vegetative (early) and reproductive (late). Soybean requires different environmental conditions during these developmental stages (Chen & Wiatrak, 2010). The vegetative stage of soybeans grown in the six test fields occurred from May to July, while the reproductive stage occurred from August to October.
Analysis of genetic relationships
We conducted genotyping of the soybeans to estimate the correlation between genetic characteristics and agricultural traits. Genotyping of the soybeans was conducted using allele- specific DNA markers (Table 1) that distinguish recessive alleles from those that are dominant at the maturity loci (E1, E2, E3, and E4), and the determinate growth habit locus (Dt1) (Xu et al., 2013). Additionally, we constructed an Unweighted Pair Group Method with Arithmetic Mean (UPGMA) genetic tree using SSR markers that are significantly associated with each trait (Table 2; Sebastian et al., 2010; Hu et al., 2014; Rodrigues et al., 2016). The tree was visualized using MEGA version 4.0 (Tamura et al., 2007).
Table 1. Allele-specific DNA markers that distinguish alleles at the maturity loci (E1, E2, E3, and E4) and the determinate growth habit locus (Dt1) in soybean.
Table 2. SSR markers associated with days to flowering (DTF), days to maturity (DTM), stem length (STL), 100-seed weight (HSW), and yield (YLD) for the analysis of genetic relationships
| Trait | Marker | No. of Chr | Position (cM) | Repeat | Reference |
| DTF | Satt322 | Chr.06 | 82.23 | (ATT)10 | Hu et al., 2014 |
| Satt636 | Chr.07 | 5 | (ATT)22 | Hu et al., 2014 | |
| Satt150 | Chr.07 | 18.58 | (ATT)20 | Hu et al., 2014 | |
| Satt417 | Chr.09 | 46.2 | (ATT)18 | Hu et al., 2014 | |
| Satt405 | Chr.16 | 12.41 | (ATT)9 | Hu et al., 2014 | |
| satt285 | Chr.16 | 25.51 | (ATT)19 | Hu et al., 2014 | |
| satt564 | Chr.18 | 57.32 | (ATT)22 | Hu et al., 2014 | |
| Satt594 | Chr.18 | 52.94 | (ATT)23 | Rodrigues et al., 2016 | |
| DTM | Satt408 | Chr.01 | 106.69 | (ATT)19 | Hu et al., 2014 |
| Satt521 | Chr.03 | 65.46 | (ATT)12 | Hu et al., 2014 | |
| sat_304 | Chr.03 | 77.1 | (AT)31 | Hu et al., 2014 | |
| satt718 | Chr.04 | 73.79 | (ATC)15, (ATT)15 | Hu et al., 2014 | |
| sctt010 | Chr.18 | 45.87 | (CTT)8 | Hu et al., 2014 | |
| Satt191 | Chr.18 | 96.57 | (ATT)18 | Rodrigues et al., 2016 | |
| satt614 | Chr.20 | 31.94 | (ATT)37 | Hu et al., 2014 | |
| STL | satt342 | Chr.01 | 48.14 | (ATT)21 | Hu et al., 2014 |
| Satt436 | Chr.01 | 70.69 | (ATT)28 | Rodrigues et al., 2016 | |
| satt641 | Chr.03 | 29.28 | (ATT)10 | Hu et al., 2014 | |
| sat_137 | Chr.05 | 0 | (AT)16 | Hu et al., 2014 | |
| satt385 | Chr.05 | 64.74 | (ATT)22 | Hu et al., 2014 | |
| Satt454 | Chr.05 | 28.08 | (ATT)17 | Rodrigues et al., 2016 | |
| satt389 | Chr.17 | 79.23 | (ATT)22 | Hu et al., 2014 | |
| Satt191 | Chr.18 | 96.57 | (ATT)18 | Rodrigues et al., 2016 | |
| Satt354 | Chr.20 | 46.22 | (ATT)14 | Rodrigues et al., 2016 | |
| HSW | Satt370 | Chr.01 | 60.99 | (ATT)13 | Rodrigues et al., 2016 |
| satt227 | Chr.06 | 26.65 | (ATT)9 | Hu et al., 2014 | |
| satt210 | Chr.07 | 112.08 | (ATT)25 | Hu et al., 2014 | |
| Satt536 | Chr.07 | 62.14 | (ATT)20 | Rodrigues et al., 2016 | |
| sat_334 | Chr.12 | 59.01 | (AT)21 | Hu et al., 2014 | |
| satt516 | Chr.13 | 44.42 | (ATT)19 | Hu et al., 2014 | |
| satt706 | Chr.15 | 43.36 | (ATT)23 | Hu et al., 2014 | |
| Satt263 | Chr.15 | 45.4 | (ATT)19 | Rodrigues et al., 2016 | |
| Satt529 | Chr.16 | 41.9 | (ATT)13 | Rodrigues et al., 2016 | |
| Satt154 | Chr.17 | 57.07 | (ATT)20 | Rodrigues et al., 2016 | |
| Satt303 | Chr.18 | 53.42 | (ATT)20 | Rodrigues et al., 2016 | |
| Satt562 | Chr.20 | 22.84 | (ATT)18 | Rodrigues et al., 2016 | |
| Satt419 | Chr.20 | 21.9 | (ATT)22 | Rodrigues et al., 2016 | |
| YLD | Satt216 | Chr.02 | 9.8 | (ATT)19 | Sebastian et al., 2010 |
| satt641 | Chr.03 | 29.28 | (ATT)10 | Hu et al., 2014 | |
| Satt521 | Chr.03 | 65.46 | (ATT)12 | Hu et al., 2014 | |
| Satt190 | Chr.04 | 73.32 | (ATT)15 | Sebastian et al., 2010 | |
| satt316 | Chr.06 | 127.67 | (ATT)12 | Hu et al., 2014 | |
| Satt307 | Chr.06 | 121.27 | (ATT)12 | Sebastian et al., 2010 | |
| Satt429 | Chr.08 | 162.03 | (ATT)25 | Sebastian et al., 2010 | |
| Satt556 | Chr.14 | 73.21 | (ATT)14 | Sebastian et al., 2010 | |
| Satt594 | Chr.18 | 52.94 | (ATT)23 | Sebastian et al., 2010 | |
| Satt352 | Chr.18 | 50.53 | (ATT)18 | Sebastian et al., 2010 | |
| sct_010 | Chr.19 | 59.52 | (CT)10 | Hu et al., 2014 | |
| Satt497 | Chr.19 | 33.71 | (ATT)22 | Sebastian et al., 2010 | |
| Satt292 | Chr.20 | 82.78 | (ATT)16 | Sebastian et al., 2010 |
Statistical analysis
Pearson’s correlation coefficients (PCC; Prob > |r| under H0: Rho = 0, p < 0.05) for agricultural performance traits and/or climatic conditions were analyzed with SAS 9.2 (SAS Institute Inc., Cary, NC, USA) and used to assess the degree of correlation. Multiple comparisons of the soybeans within the experimental test fields were performed using the least significant difference (LSD; p < 0.05; total degrees of freedom (DF) = 30 or 24).
RESULTS
Correlation between climatic conditions
DL of the test fields showed a highly positive correlation with latitude; higher latitude fields had longer DL (Fig. 2, Supplementary Table 1). Differences in climatic condition between the test fields were very small in late DL and ACCT (Table 3, Supplementary Table 2). AVT showed a negative correlation with latitude. PRC and AVT were also negatively correlated with DL (Fig. 2, Supplementary Table 1). In particular, latitude and DL showed highly positive correlations with late PRC and late ACCT but no correlations with PRC and ACCT (Fig. 2, Supplementary Table 1). PRC in Suwon (37°16′N) was the highest among the regions and Harbin showed the lowest PRC. AVT was the highest in Qingdao (36°26′N) and Dalian (39°30′N) had the highest ACCT (Fig. 2, Supplementary Table 1).
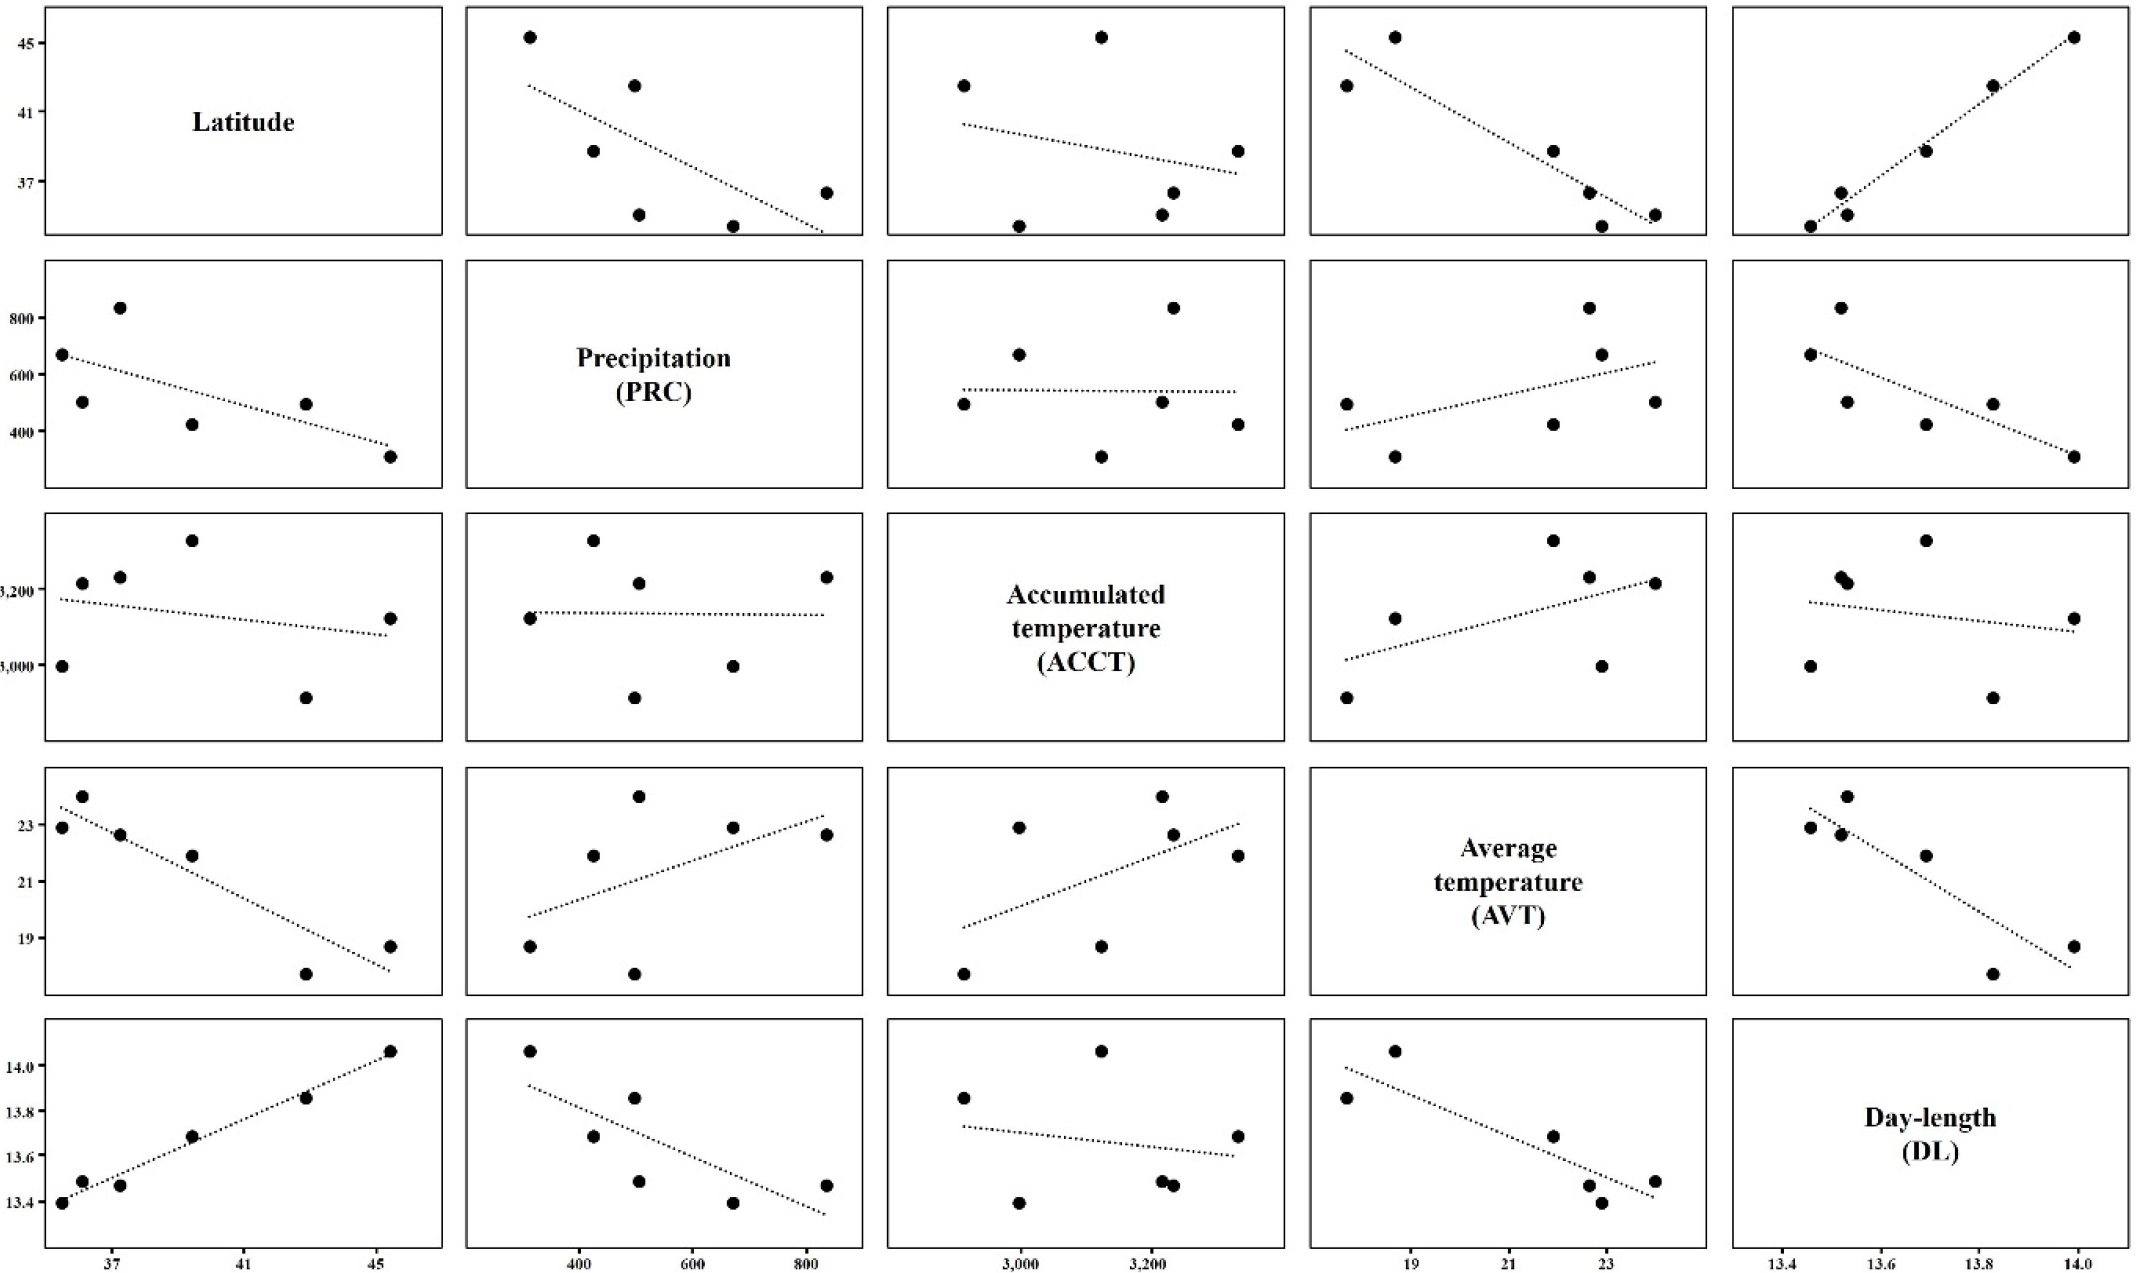
Table 3. Statistical data for latitude, precipitation (PRC), average temperature (AVT), accumulated temperature (ACCT), and day-length (DL) of the six experimental sites in China and the Republic of Korea.
Correlations between agricultural performance traits
Pods of four cultivars grown at Harbin (‘Hannamkong’, ‘Keumgangkong’, ‘Tawonkong’, and ‘Duyoukong’) matured after the frost-free period therefore, we could not measure the DTM, HSW, and YLD for these soybeans. DTF of all the soybeans showed positive correlations with DTM, STL, and YLD; however, YLD was negatively correlated with HSW (Fig. 3, Supplementary Table 3). Regional differences in HSW of the soybeans were mostly very low when compared with the other traits; differences between DTF values were the largest (Table 4, Supplementary Table 4). The DTF of ‘Hannamkong’ was the longest among the soybeans, while OT89-5 had the shortest DTF; the difference in DTF between them was 22.9 days (Table 4, Supplementary Table 4). The DTM of ‘Hannamkong’ was the shortest, although it showed the longest DTF, while OT94-39 had the longest DTM (69.4 days). OT93-28 had the tallest STL; OT94-37 was the shortest. In the case of YLD, ‘Tawonkong’ had the highest values, and OT93-28 had the lowest (Table 4, Supplementary Table 4).
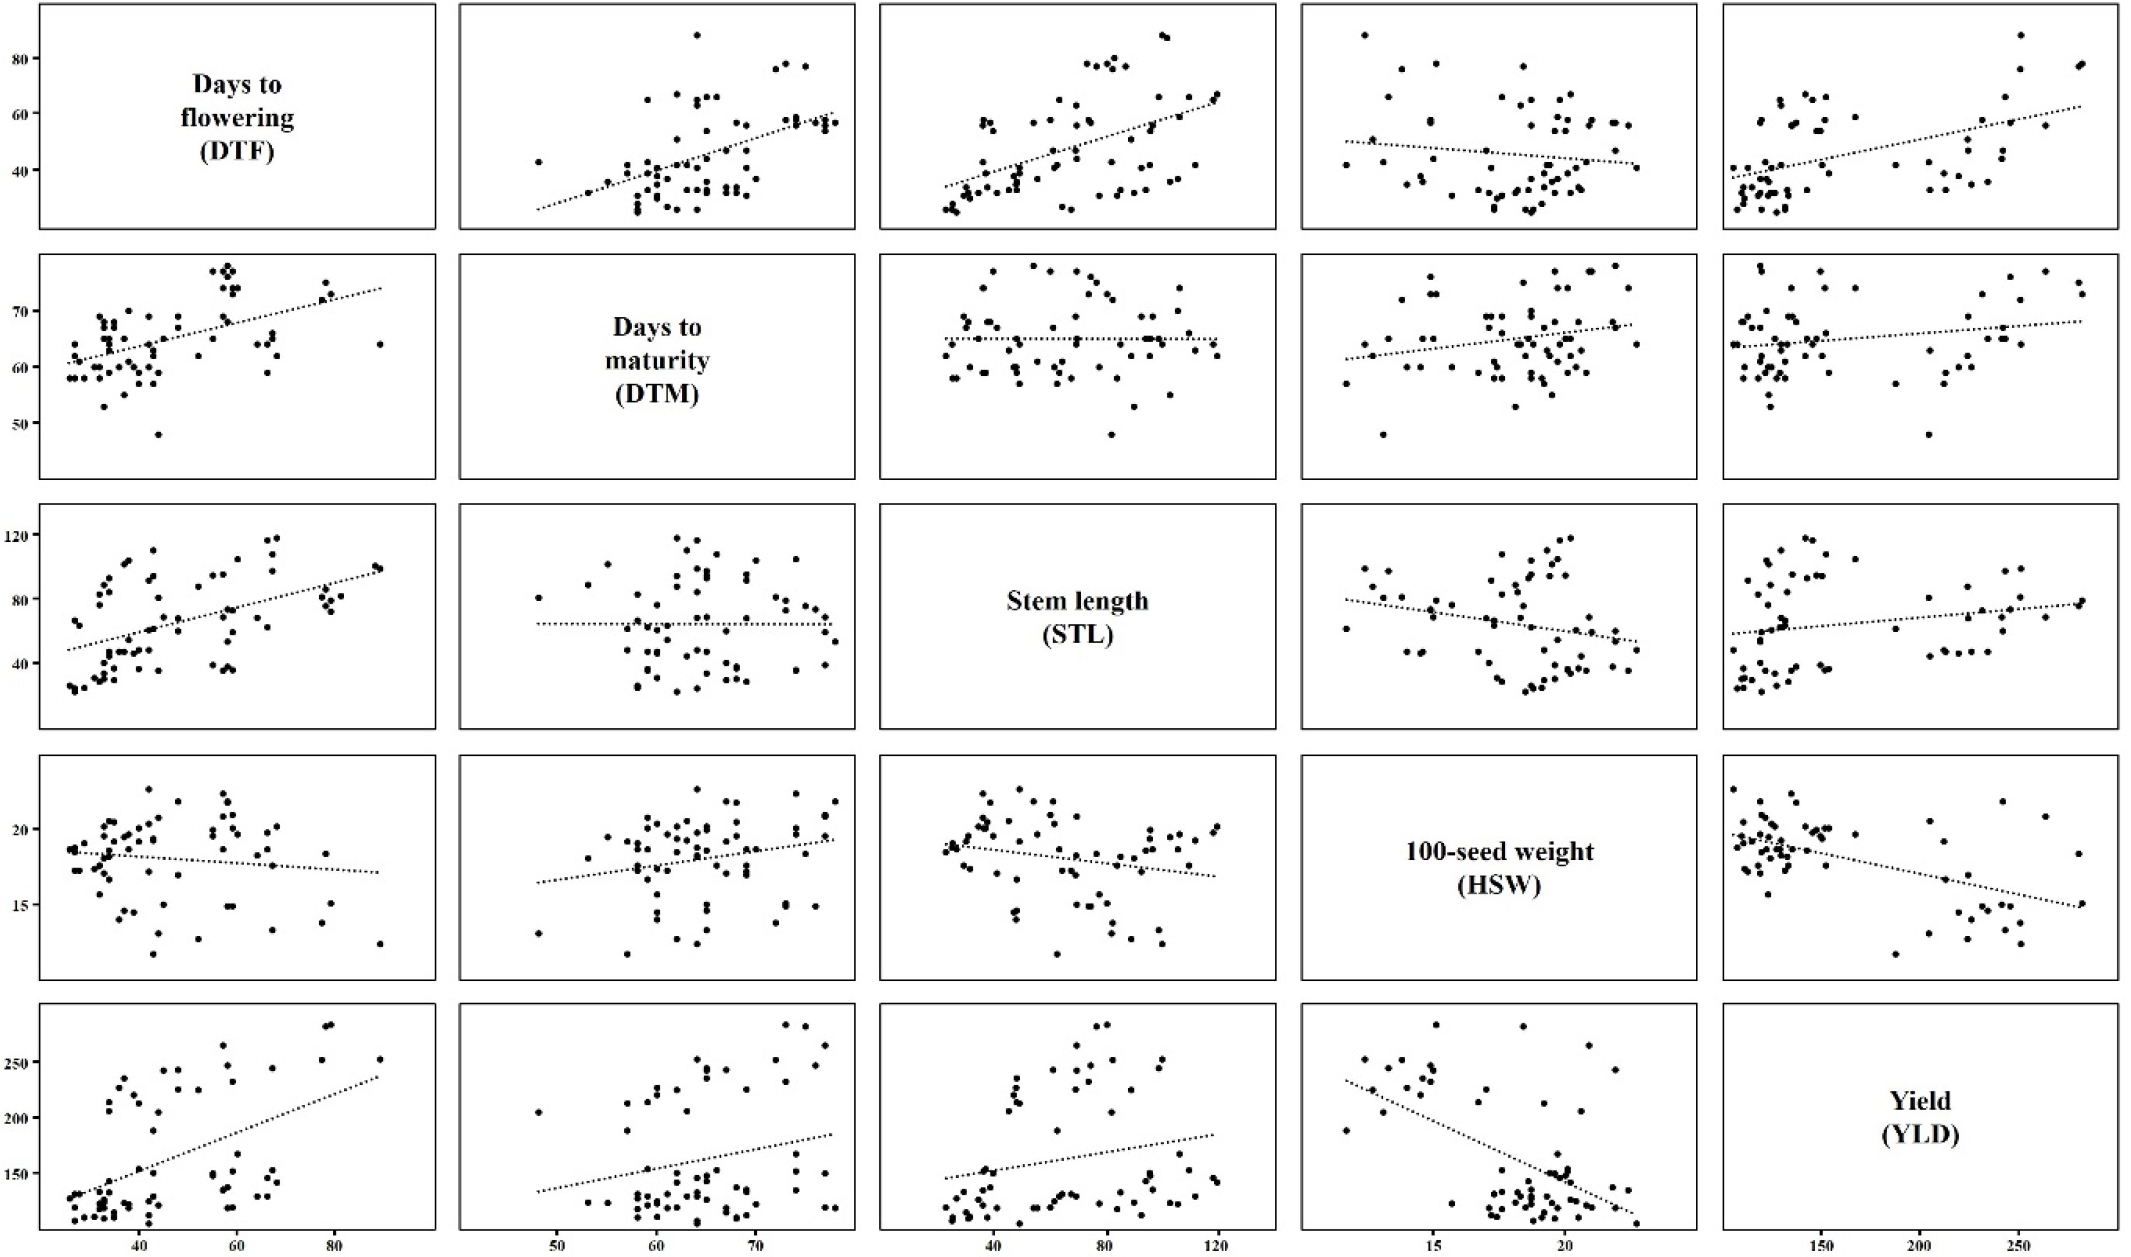
Table 4. Statistical data for days to flowering (DTF), days to maturity (DTM), stem length (STL), 100-seed weight (HSW), and yield (YLD) of soybeans grown at six experimental fields in China and the Republic of Korea.
Genetic relationships and genotypes
The genetic trees of the soybeans were based on SSR markers that are significantly associated with each agronomic trait. These trees were differentially constructed by trait (Fig. 4). The tree based on SSR markers related to DTF had 5 subclades at a genetic distance of 0.5 (Fig. 4A). Subclade I, the subclade to which ‘Hannamkong’ belongs, was very different genetically from the other subclades (Fig. 4A). Soybeans in subclades III and IV showed the shortest DTF (Fig. 4A, Table 4, Supplementary Table 4). Genotypes performed using the four major E genes (E1 to E4) and the stem growth habit locus (Dt1) differed significantly between soybeans (Table 5). The DTF of soybeans that had predominantly E3 and E4 alleles was more than 55 d; ‘Tawonkong’ only had the E4 allele and had a DTF of 55.3 d (Tables 4 and 5). The tree associated with DTM also formed five subclades at a genetic distance of 0.5 (Fig. 4B). ‘Hannamkong’, which had the longest DTF and the shortest DTM, was categorized in subclade III in the tree related to DTM (Table 4, Supplementary Table 4). The tree associated with STL showed six subclades at a genetic distance of 0.5 (Fig. 4C). In the tree associated with STL, subclade VI (including L62-667, OT89-5, and OT93-28) had the longest STL among the subclades on average; however, subclade V (including OT94-37 and OT89-6) showed the shortest STL (Table 4, Supplementary Table 4). The soybeans that had a recessive dt1 allele, except ‘Keumgangkong’ and ‘Duyoukong’, had STL of less than 55 cm (Tables 4 and 5). The tree associated with HSW formed three subclades and subclade I, including ‘Hannamkong’, ‘Tawonkong’, and ‘Duyoukong’, was genetically located the furthest from the other subclades (Fig. 4D). The tree associated with YLD also showed three subclades, and subclade I, including ‘Hannamkong’ and ‘Keumgangkong’, differed genetically from the other subclades (Fig. 4E).
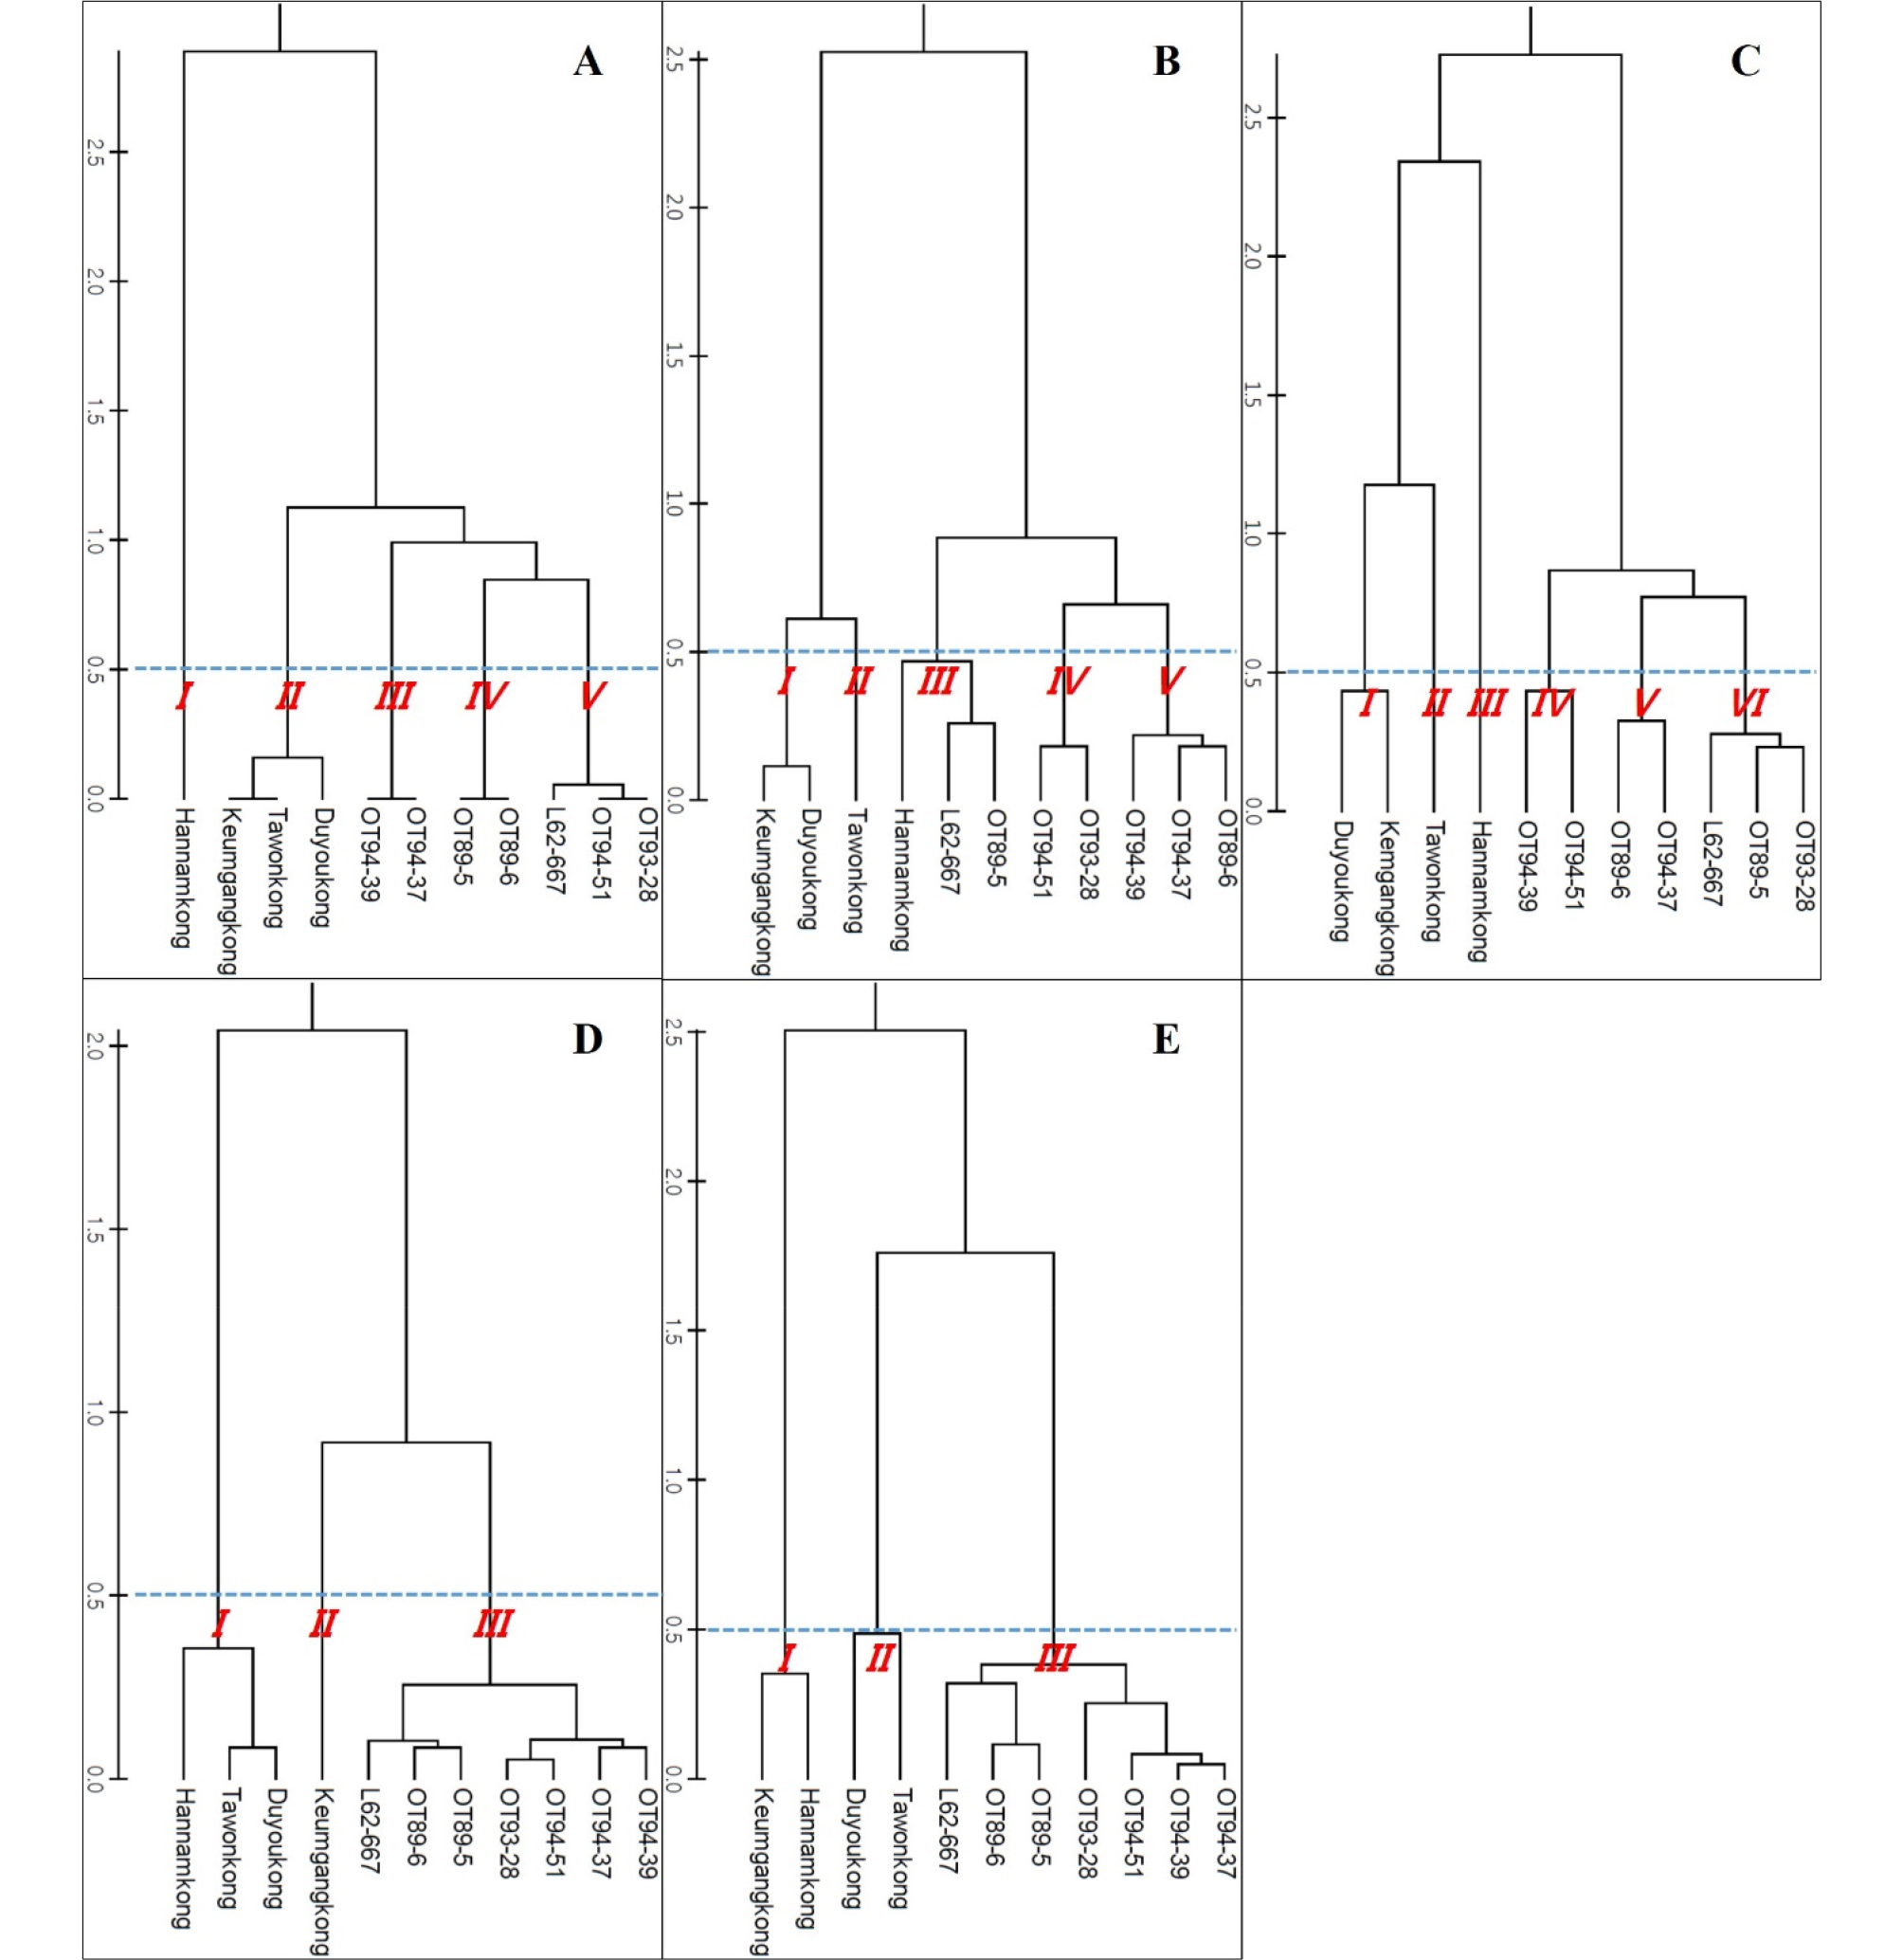
Table 5. Genotypes of the soybeans grown at six experimental fields in China and the Republic of Korea.
Correlations between climatic conditions and agricultural performance traits
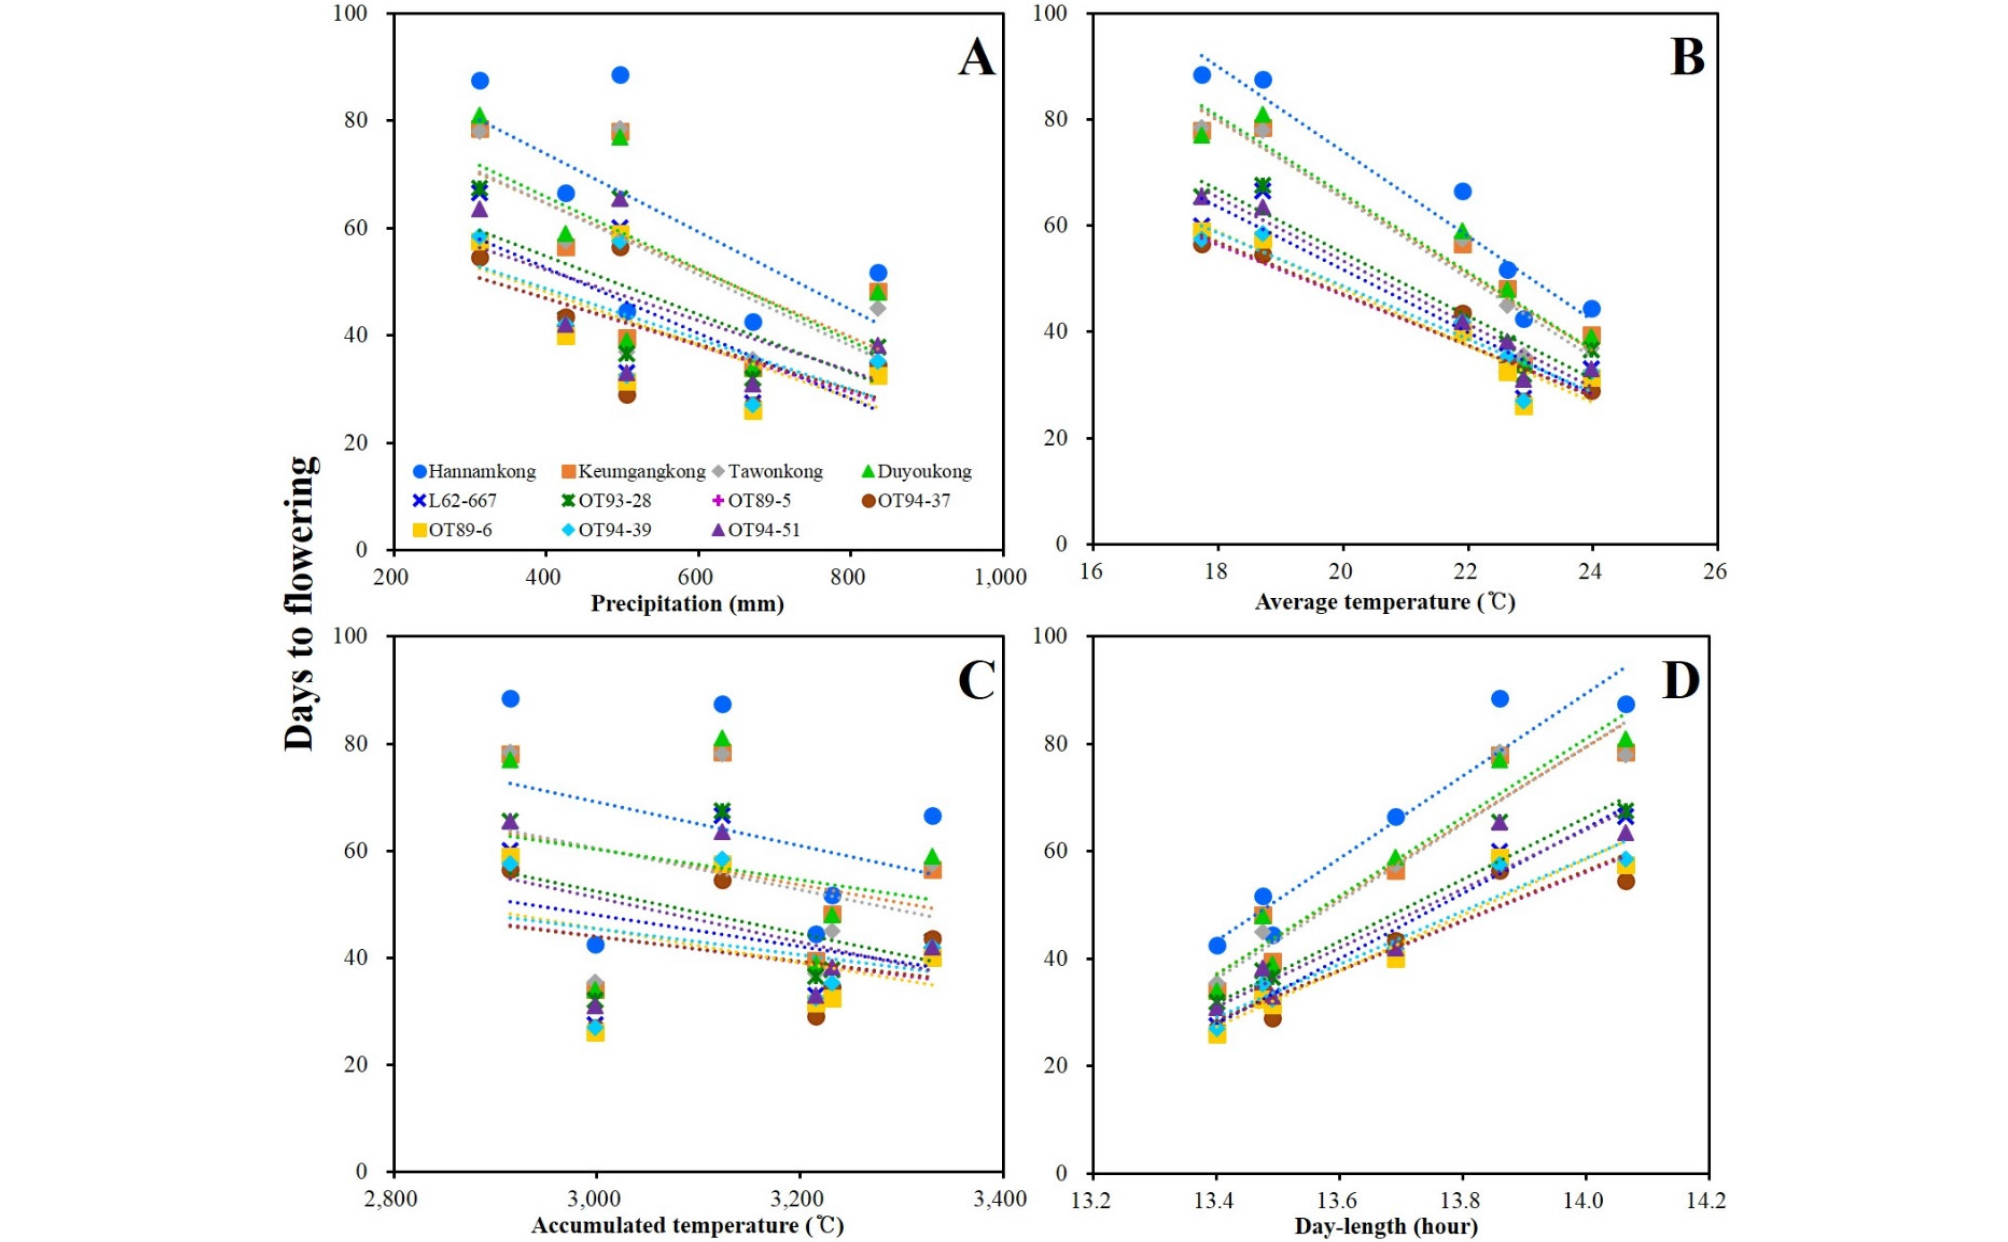
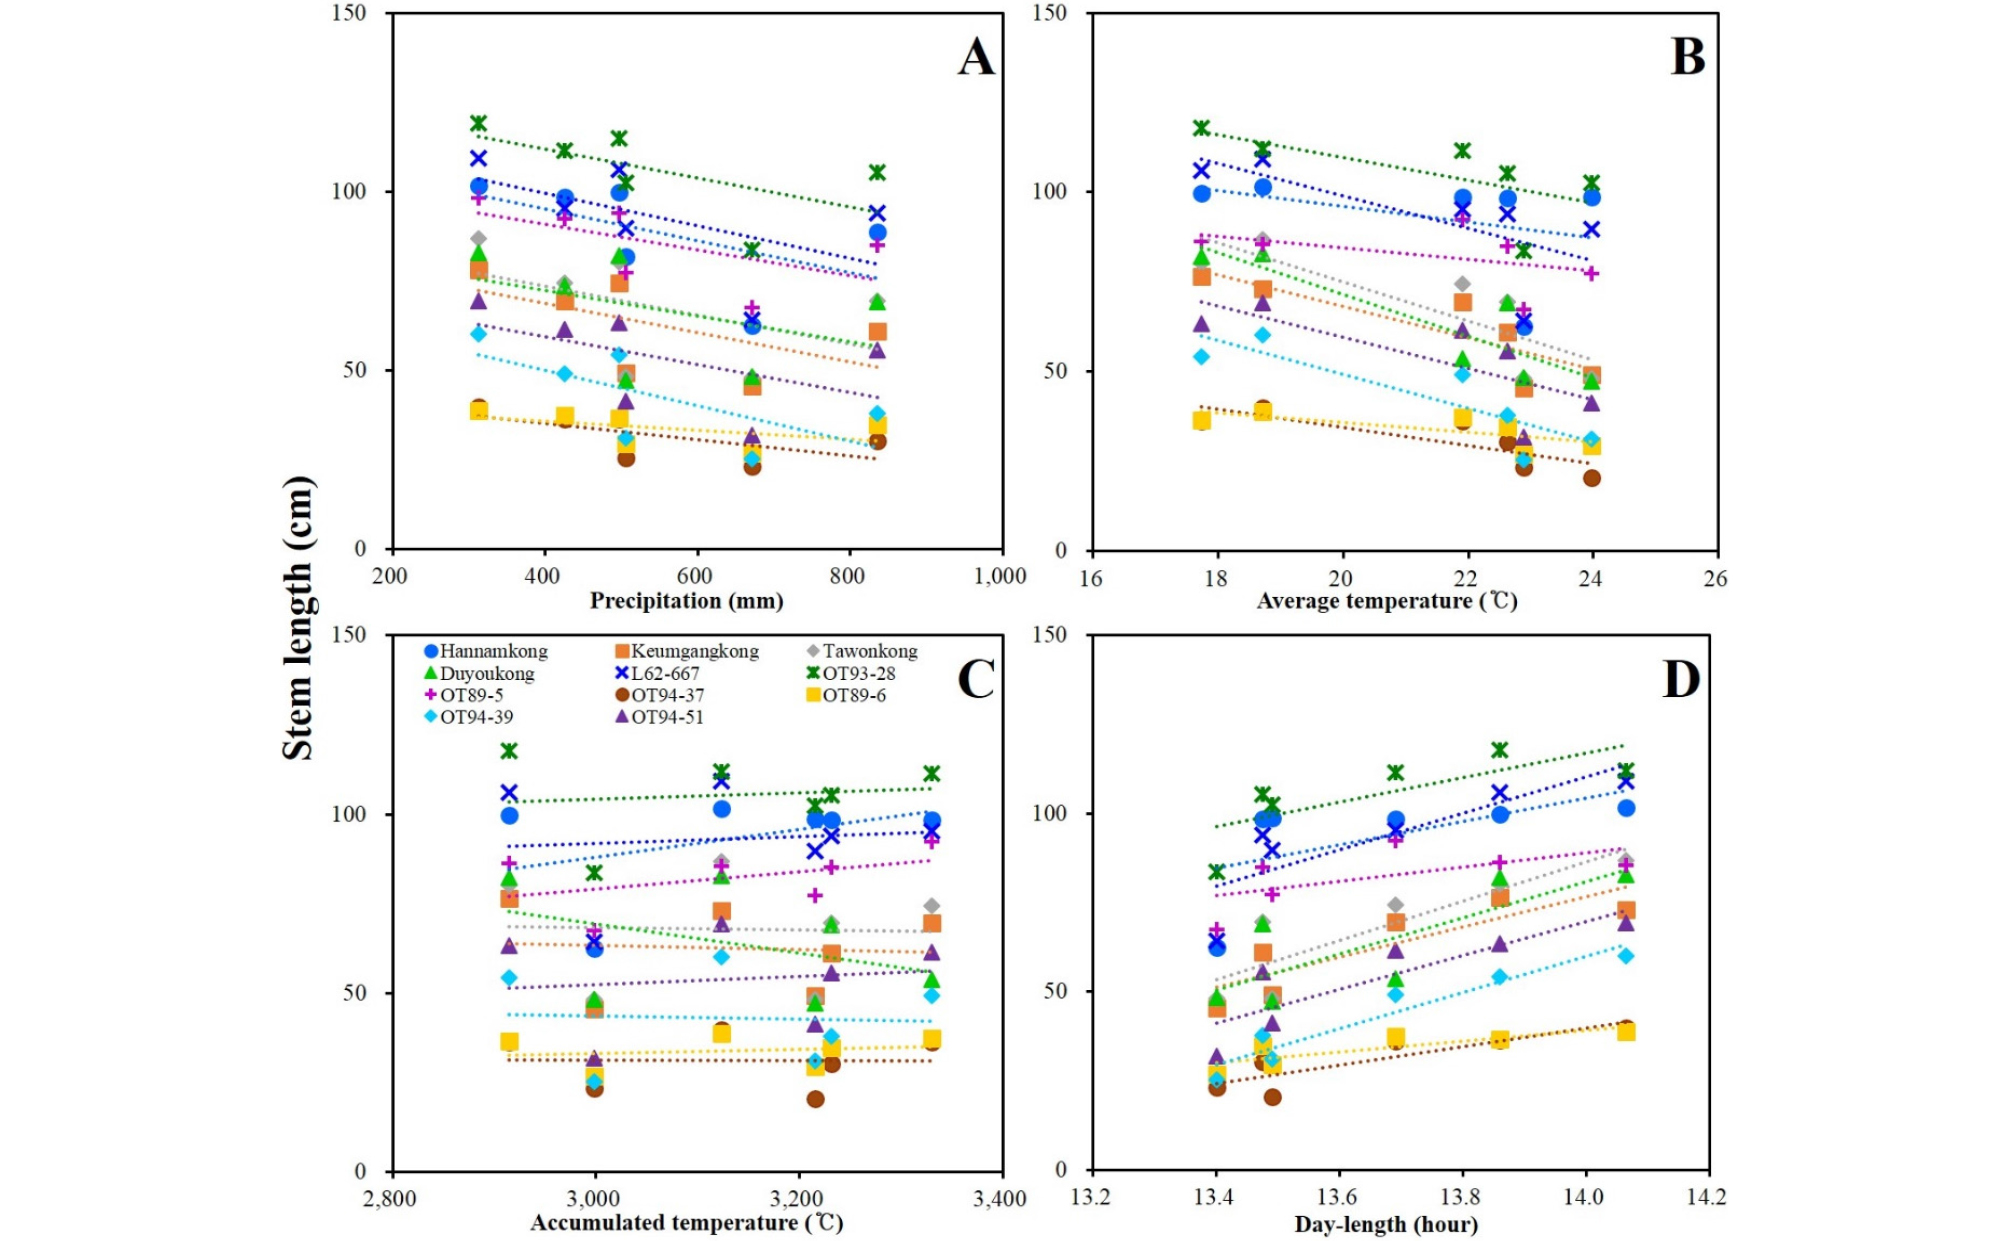
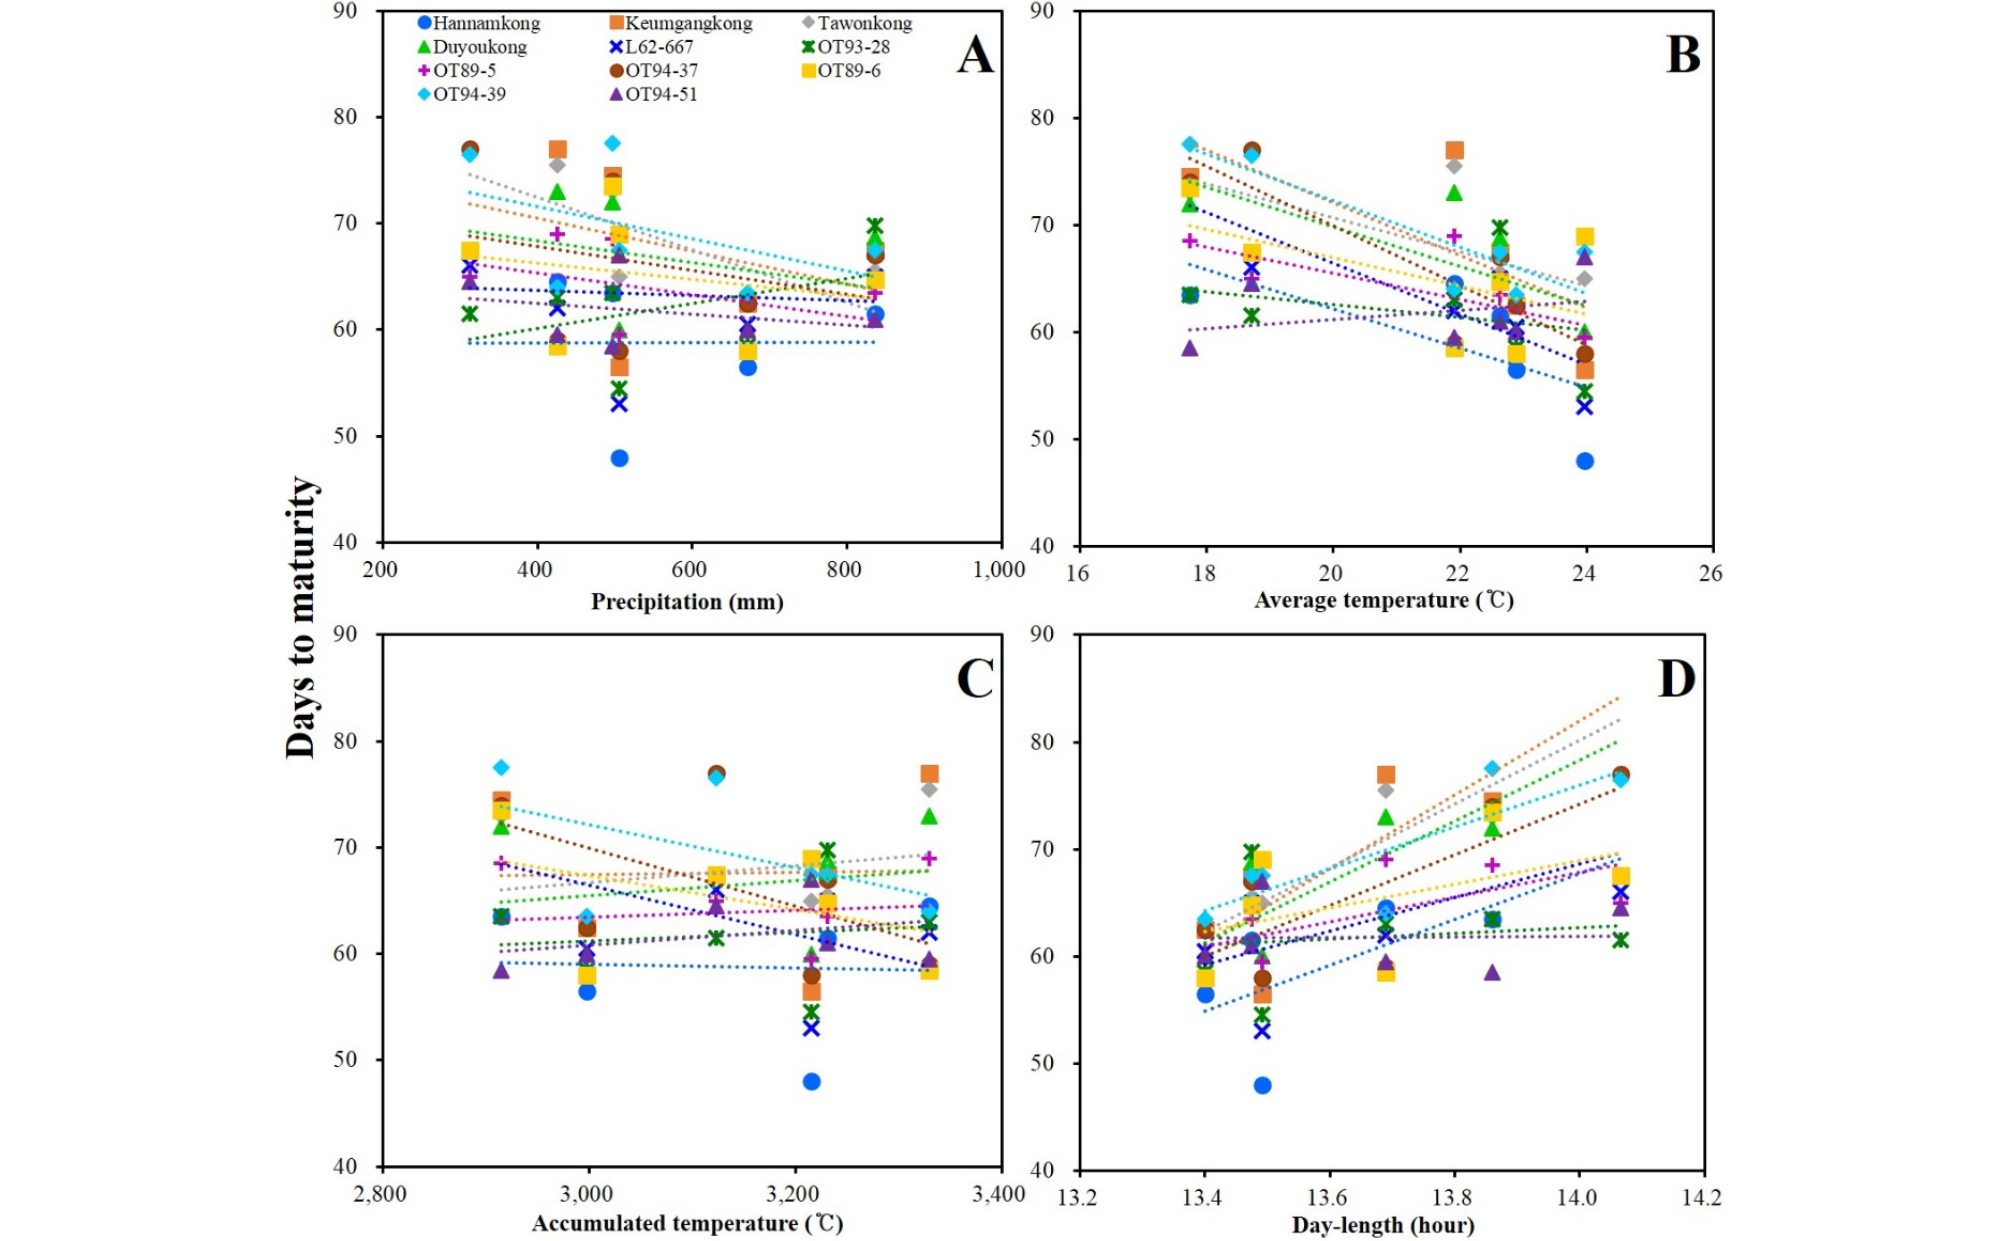
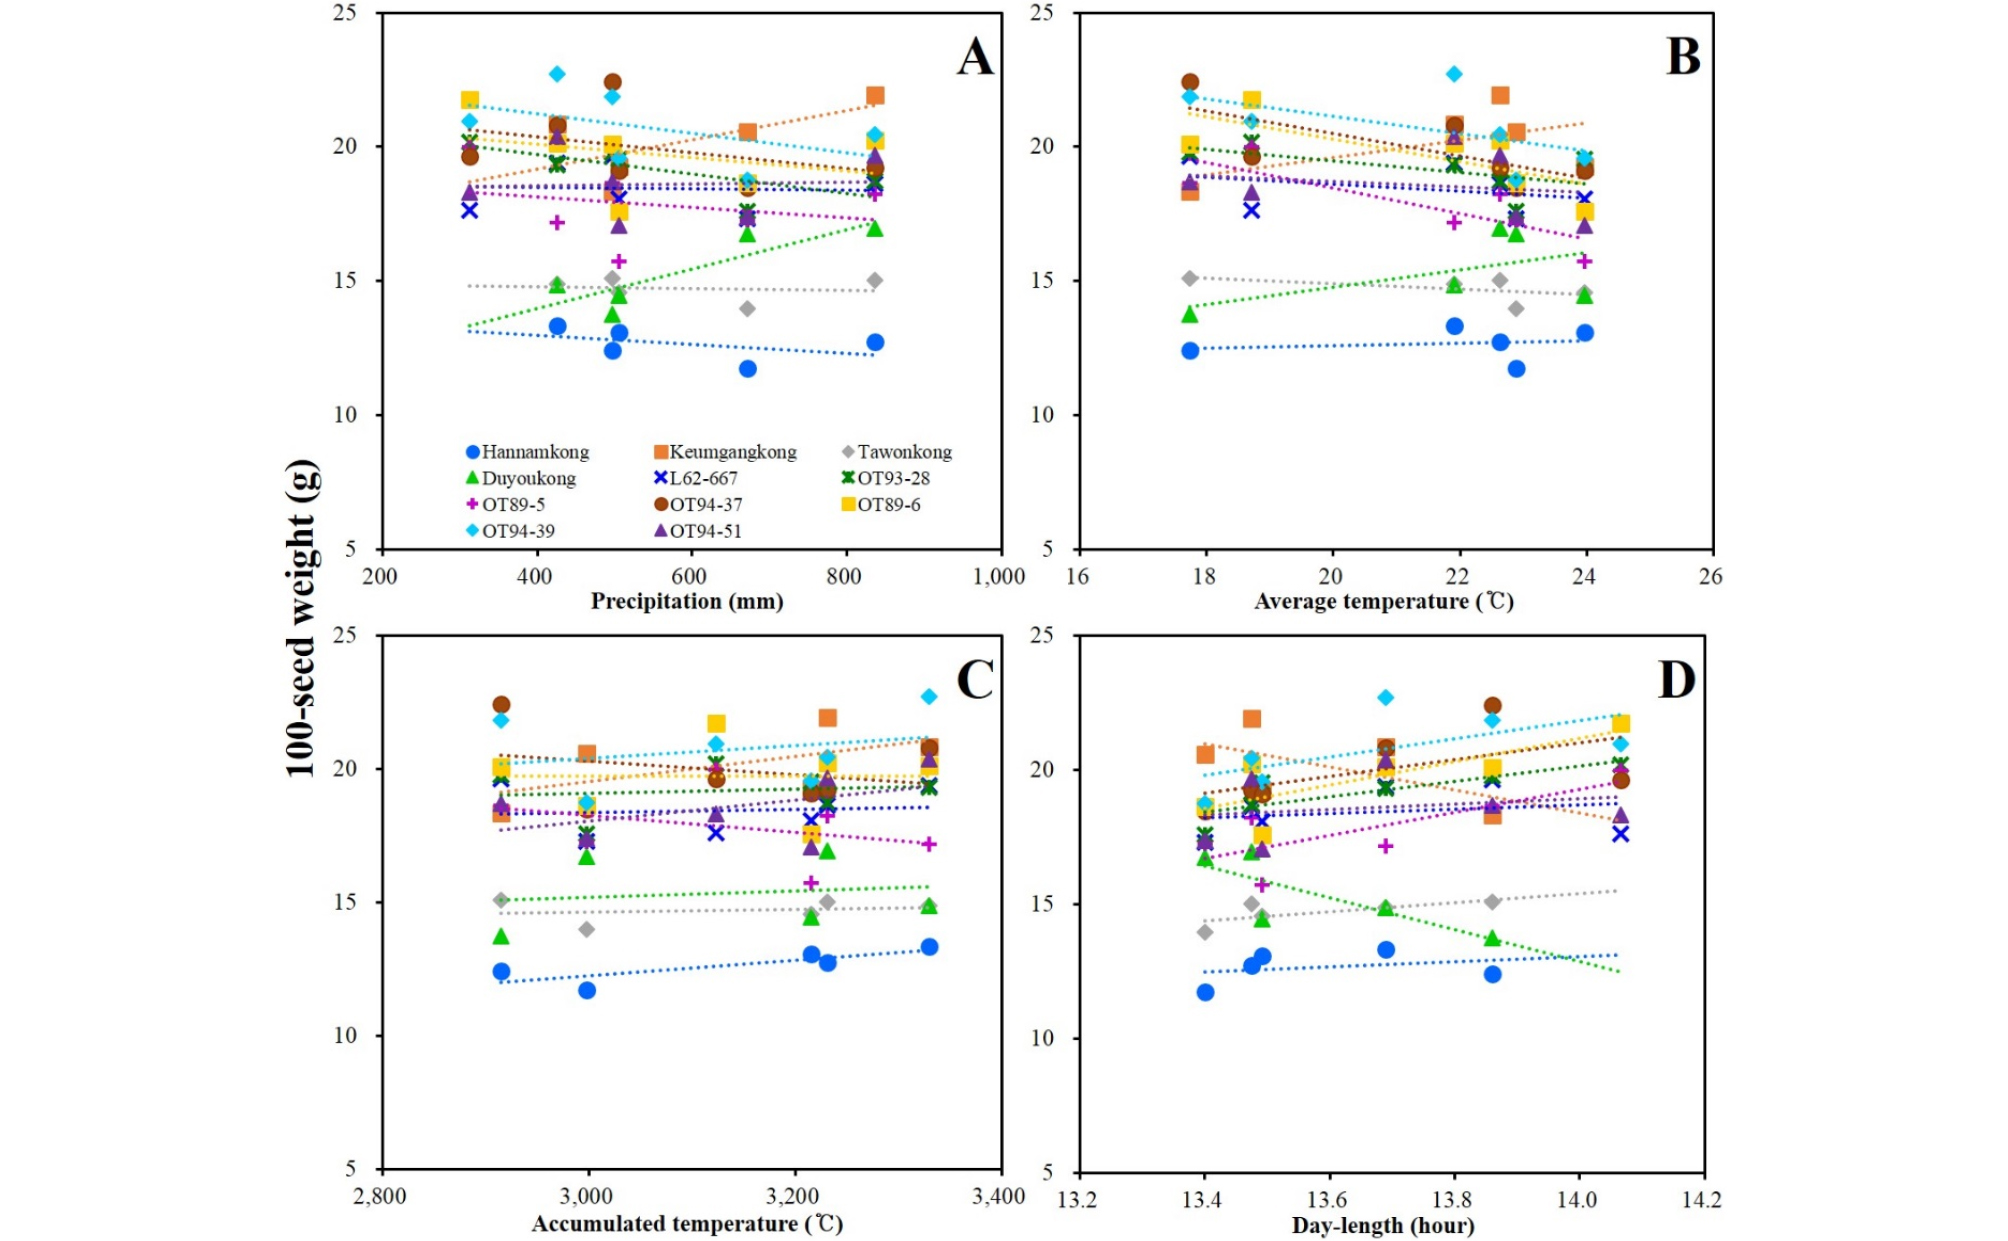
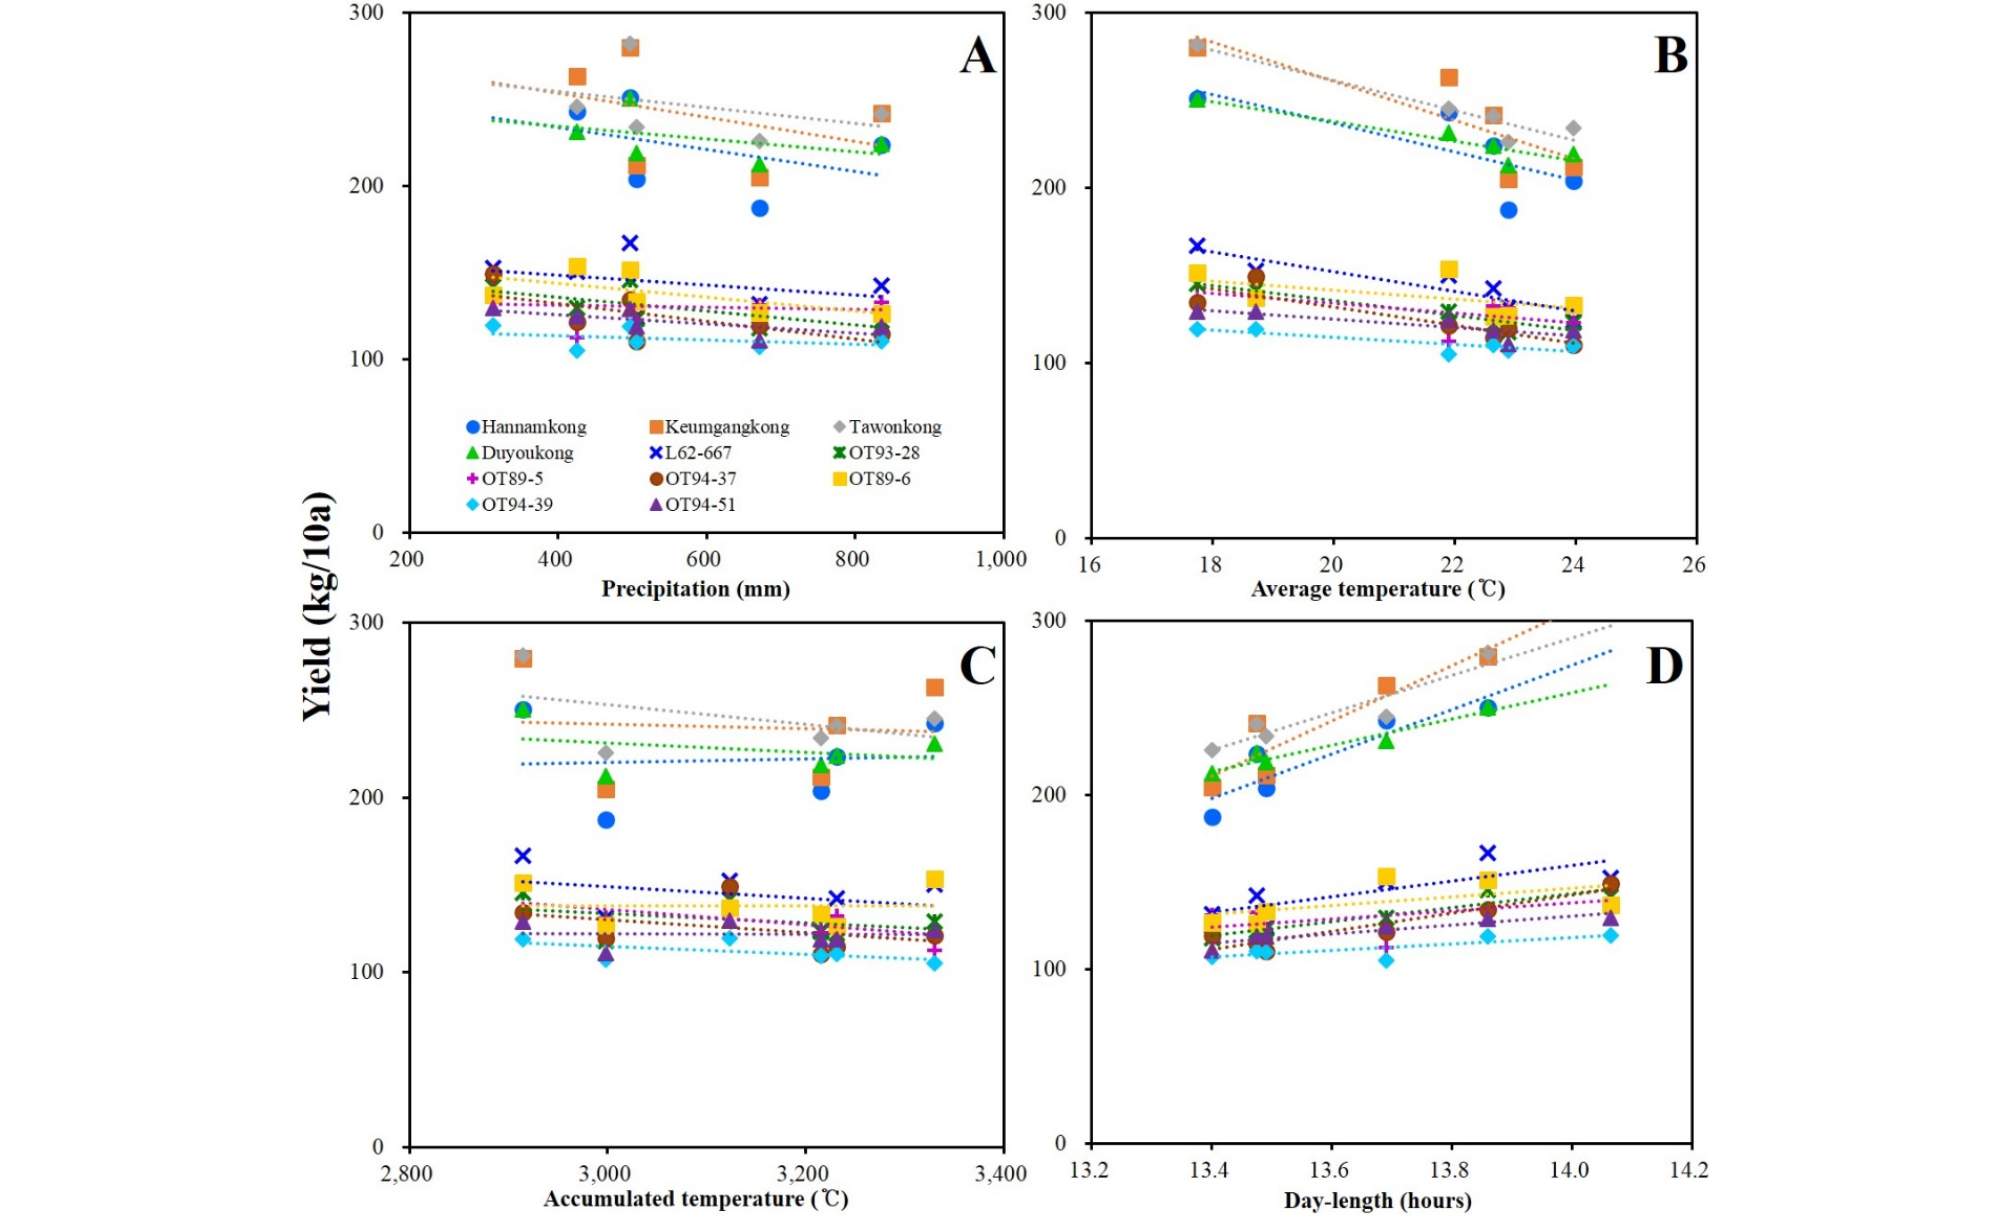
DTF of the soybeans showed high negative and positive correlations with AVT and DL, respectively. DTF showed no significant correlation with PRC or ACCT (Fig. 5, Supplementary Table 5). STL showed positive correlation with latitude and DL; however, a negative correlation with late PRC was observed (Fig. 6, Supplementary Table 5). DTM and HSW showed no significant correlation with any of the climatic conditions (Figs. 7 and 8, Supplementary Table 5). YLD also showed positive correlations with latitude and DL, except in L62-667, OT89-5, and OT89-6 (Fig. 9, Supplementary Table 5). The soybeans were largely separated into two groups by yield without reference to climatic conditions: the first group included ‘Hannamkong’, ‘Keumgangkong’, ‘Tawonkong’, and ‘Duyoukong’, while the second included L62-667, OT93-28, OT89-5, OT94-37, OT89-6, OT94-39, and OT94-51 (Fig. 9).
Complementary data
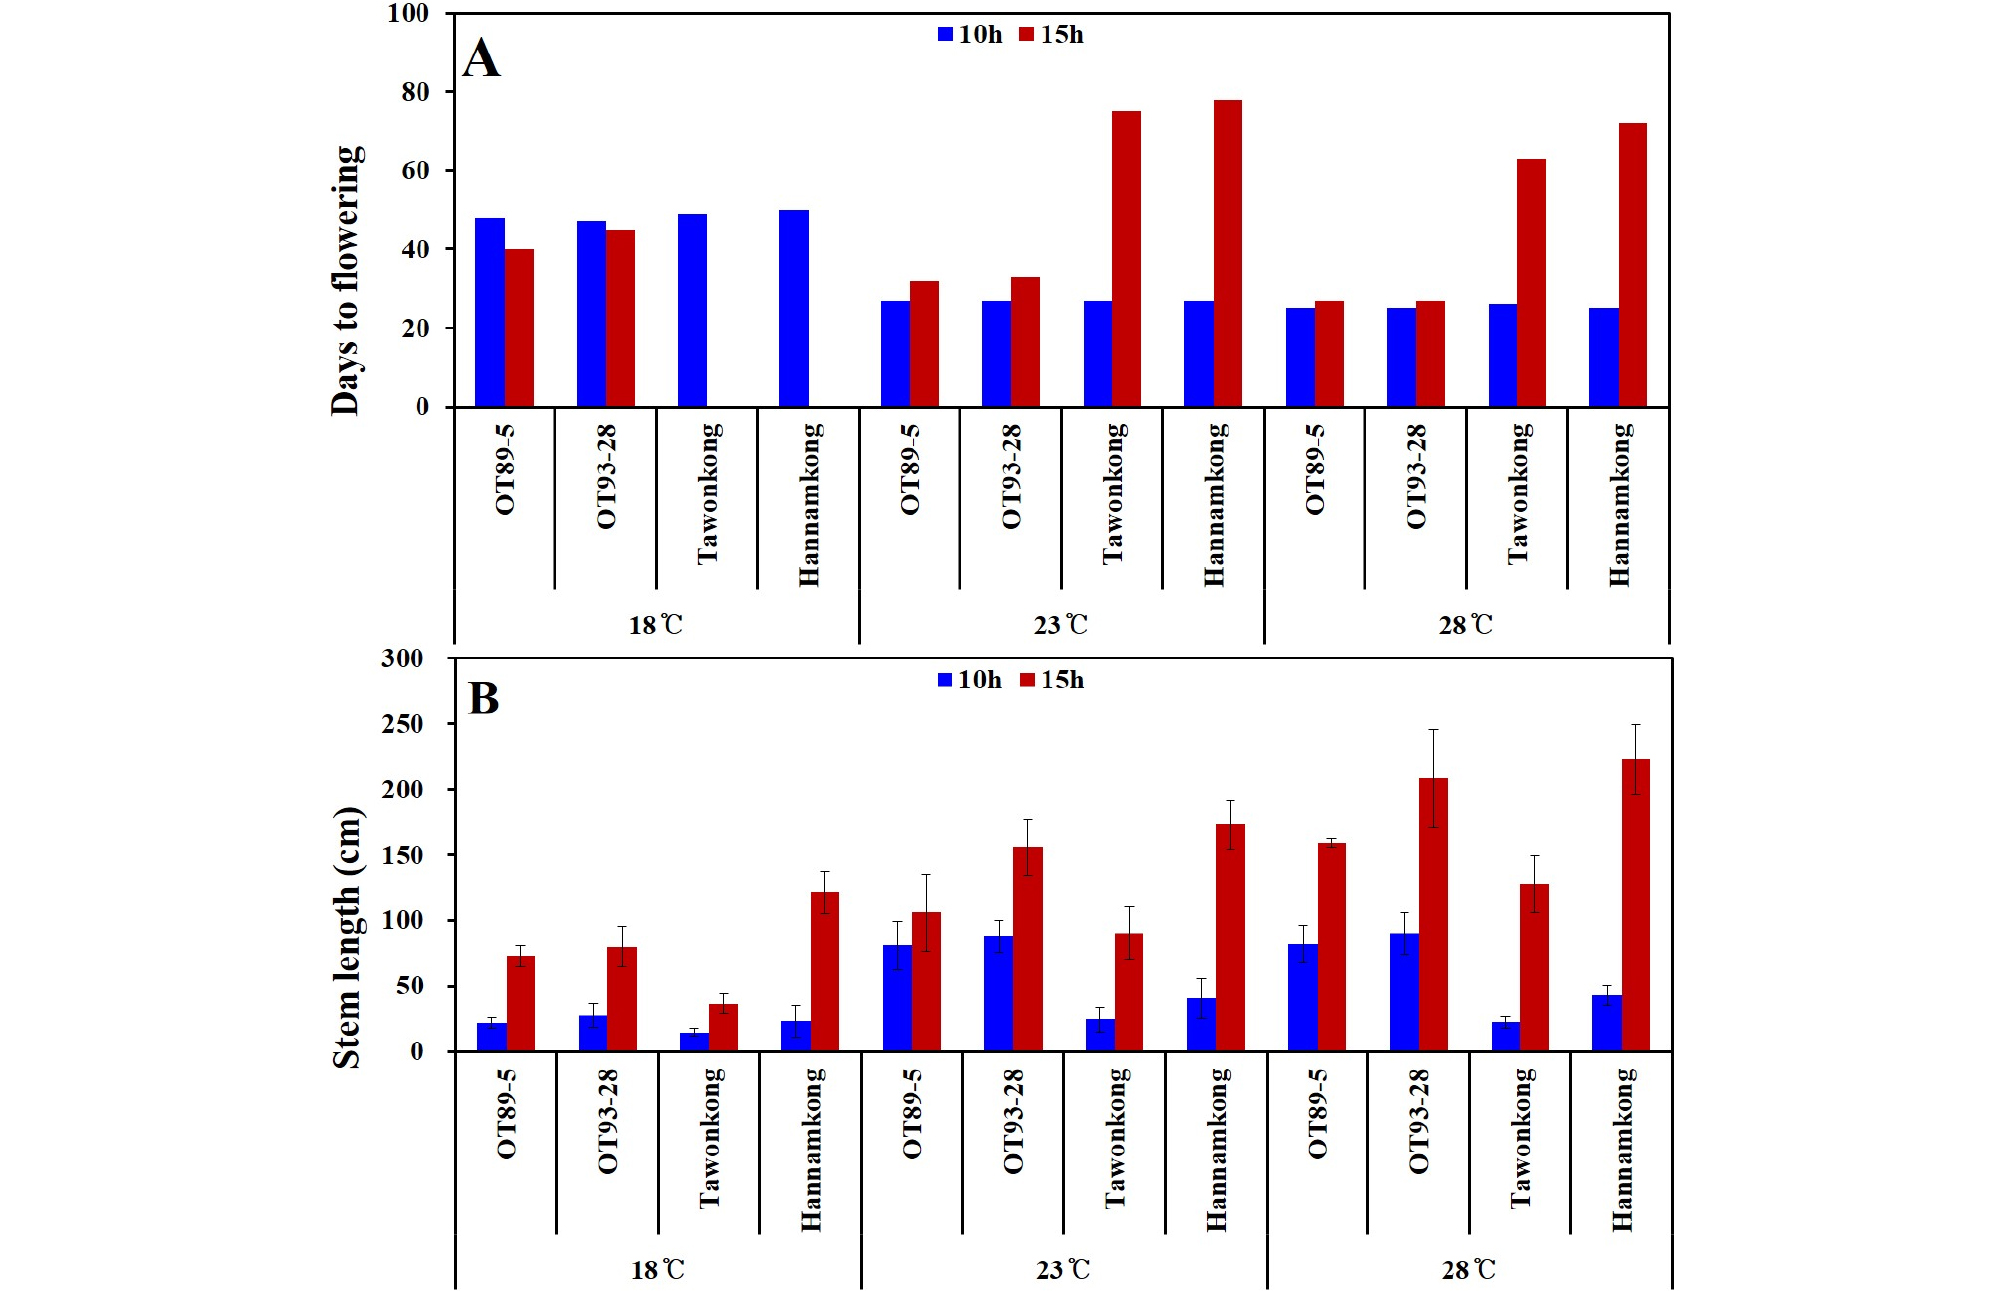
Owing to a temperature of 18°C and DL of 15 h, ‘Tawonkong’ and ‘Hannamkong’ did not bloom until after soybeans under other conditions were completely harvested (Fig. 10A). Soybeans grown between 23 and 28°C, without considering DL, showed a similar DTF (Fig. 10A). The DTF of all soybeans grown at 23 and 28°C under 10 h DL was similar but the DTF of ‘Tawonkong’ and ‘Hannamkong’ at 15 h DL was significantly different from those grown at 10 h DL (Fig. 10A). Under 15 h DL, as temperature increased, STL of all soybeans lengthened (Fig. 10B). Nonetheless, each soybean grown at 23 and 28°C under 10 h DL had a similar STL (Fig. 10).
DISCUSSION
Effect of climatic conditions and genetic characteristics on flowering and maturity
Climatic conditions including precipitation (Berlato, 1981; Cox & Jolliff, 1986), temperature (Van Schaik & Probst, 1958), and day-length (Garner & Allard, 1930; Hadley et al., 1984) are important to the agricultural performance of soybean. Thus, understanding regional climatic characteristics is useful for assessing the effects of climatic conditions on the agricultural performance of different soybean varieties. As expected, the higher the latitude, the higher the DL and the lower the AVT. Latitude showed a negative correlation with PRC (Fig. 2, Supplementary Table 1), which had diverse effects on all stages of soybean growth and development.
Fukui & Arai (1951) have separately recorded the days from germination to blooming and the days from blooming to maturity, with special reference to soybean’s geographical differentiation. This was in an effort to ecologically classify soybeans. Several scientists have used days from sowing to R8 (full maturity) to classify maturity groups of soybeans based on their response to photoperiod or latitude (Hartwig, 1973; Saito & Hashimoto, 1980; Penariol, 2000; Gai et al., 2001; Rüdelsheim & Smets, 2014). However, in previous studies, the days to R1 (DTF) and days to R8 (DTM) were calculated separately to obtain the ratio of R1 to R8 (Liu et al., 2017) and to estimate the days to R8, as some cultivars did not achieve full maturity before the beginning of the frost period (Zhai et al., 2014). We recorded DTF and DTM of soybeans separately and examined them in relation to geographical differentiation because we confirmed via preliminary tests that some of the cultivars developed in the Republic of Korea did not mature before the beginning of the frost period in Harbin.
Xia et al. (2012) reported that the E1 allele has a major impact on flowering and maturity. The recessive e1 allele displayed an early-flowering-time phenotype without reference to the genetic background at other E loci or DL conditions. Moreover, when Zhai et al. (2014) classified 180 cultivars into 8 genotypic groups using 4 major E genes (E1 to E4), all soybeans with the e1-nf and e1-as alleles and the E1e2e3e4 genotype showed shorter times to R1 (under 40 d) than did the other groups with E1. As mentioned previously, ‘Keumgangkong’, ‘Tawonkong’, and ‘Duyoukong’ belong to subclade II in the genetic tree constructed by SSR markers associated with DTF (Fig. 4A). These soybeans, with the el-as allele, showed longer DTF than the other el-as allele genotype soybeans (Xia et al., 2012; Zhai et al., 2014), although the DTF was shorter than that of ‘Hannamkong’ (Tables 4 and 5, Supplementary Tables 4). Although these results show that the genetic characteristics of soybean have an effect on DTF, the effect requires further elucidation. Fig. 5 shows that DTF of all the soybeans were highly correlated with all climatic conditions, but we could not assume that PRC and ACCT correlated with DTF as the data for late PRC and late ACCT were measured after R1 (Supplementary Table 5). For the chamber tests, we confirmed that DTF was negatively and positively correlated with AVT and DL, respectively; the effect of temperature on DTF was not significant when over 23°C (Fig. 10). However, the early AVT in the six fields was 22.6°C (Table 3, Supplementary Table 2). Based on these results, we concluded that although the DTF of soybeans grown at six different latitudes was affected by their genetic characteristics, AVT, and DL, the effect of DL was more significant than the others.
No correlation was found between the subclades and DTM (R1 to R8). In addition, DTM did not significantly correlate with any climatic conditions. As shown in Table 4, ‘Hannamkong’ showed the longest DTF and the shortest DTM. Moreover, the average DTM of the soybeans was the longest in OT94-37, OT89-6, and OT94-39. In the tree associated with DTF, these soybeans were classified into subclades III and IV, which had the shortest average DTF (Table 4, Supplementary Table 4). However, although it was confirmed the variety-specific difference of DTM in response to AVT and DL, the difference was not closely connected to distance in the DTM tree (Figs. 4B and 7, Supplementary Table 3). These results shows that interaction between genetic characteristic and climatic conditions on DTM of soybeans could not be confirmed by this study and therefore, the internal and external influences on DTM require further elucidation.
Effect of climatic conditions and genetic characteristics on stem length
Stem termination has an effect on plant height, flowering period, node production, maturity, water-use efficiency, and soybean yield (Bernard, 2001; Heatherly & Smith, 2004). Genotyping using the determinate stem allele (Dt1) plays an essential role in analysis of genetic characteristic associated with the stem length and maturity of soybean. The soybeans with a dominant Dt1 allele (except ‘Tawonkong’) and classified into subclades III and VI of the tree associated with STL had the longest average STL (Fig. 4C, Table 4, Supplementary Table 4), as in previous reports (Woodworth, 1932; Bernard, 2001). In case of STL, as shown in Fig. 6 and 4C and Supplementary Table 3, variety-specific difference in response to AVT was not related to distance in the genetic tree: AVT did not interact with genetic characteristic on STL of soybean. These results imply that its genetic characteristics have a large effect on the STL of soybean. The results of our field tests showed that STL was positively correlated with DL, but not AVT. Our chamber test confirmed that STL of soybean was positively affected by AVT and DL, as seen in previous studies (Sato, 1976; Downs & Thomas, 1990). However, the difference in the correlation results between STL and AVT in the field and chamber tests was caused by the characteristics of regional climates, where latitude showed a negative correlation with AVT (Fig. 2, Supplementary Table 1). Therefore, we concluded that STL of soybean is more affected by its genetic characteristics and DL than AVT, as with DTF.
Effect of climatic conditions and genetic characteristics on yield components
The result that YLD and HSW were negatively correlated was due to a difference in the number of seeds per plant. For example, in ‘Hannamkong’, which showed the lowest HSW, the number of seeds per plant was approximately three times higher than that in the highest HSW soybean, OT94-39 (data not shown). In the genetic tree associated with HSW, three subclades with similar HSWs were formed, as also seen in the tree associated with YLD (Fig. 4D and 4E). Many researchers have reported that HSW and YLD of soybean have the same responses to climatic conditions such as latitude, PRC, AVT, and DL (Korte et al., 1983; Hollinger & Changnon, 1993; Kantolic & Slafer, 2007; Saryoko et al., 2017). Nevertheless, HSW showed no correlation with any climatic conditions although the YLD of the soybeans, except L62-667, OT89-5, and OT89-6, showed positive correlations with latitude and DL. The soybeans were distinctly divided into two groups according to YLD, without reference to climatic conditions. This indicates that YLD of soybeans is mostly affected by its genetic characteristics. Our study showed that the soybeans that showed relatively long DTF (over 55 d) showed stronger positive correlations with YLD than others that had relatively short DTF (under 47 d). These results indicate that DTF has a large effect on YLD. Nonetheless, Yamada et al. (2012) reported two different results related to DTF and YLD of soybeans grown in the southern and northern areas of Japan. In the northern area, the YLD of the soybeans with relatively shorter DTF was higher than that of others with relatively longer DTF. The second result, however, was similar to our findings. We confirmed that variety-specific difference of YLD in response to AVT and late ACCT was closely related to the distance in the YLD tree (Fig. 4E and 9, Supplementary Table 3). These results implied that genetic characteristic of each soybean interacts with climatic conditions, AVT and late ACCT on YLD performance of soybean. Therefore, we concluded that climatic conditions selectively affect YLD based on DTF; the response of soybean YLD to climatic conditions is cultivar-specific, and more specifically based on genetic characteristics.
The DTF and STL of soybeans grown at six different latitudes in China and the Republic of Korea are affected by DL and AVT as well as genetic characteristics. DL, however, had a greater effect on DTF and STL than it had on other traits such as DTM, HSW, and YLD. Although cultivar-specific characteristics greatly contribute to the YLD of soybeans, YLD selectively responds to latitude and DL, based on the length of DTF. However, interaction between climatic condition and genetic characteristic affected according to differentially agronomic trait of soybean.
In this study, the independent and interactive effects of climatic conditions on the agricultural performance of soybeans grown at six different latitudes in China and the Republic of Korea were assessed, in an effort to understand the phenological development of soybeans in these two countries. These findings contribute to our understanding of the effects of breeding and selection of soybeans under climate change in the two countries.
SUPPLEMENTARY MATERIALS
Supplementary Table 1. Correlation coefficient values and p-values for climatic conditions of the six experimental sites in 2016 and 2017.
**early: the early growth period (May, June, and July) of soybean at each test field
***late: the late growth period (August, September, and October) of soybean at each test field
Supplementary Table 2. Regional climatic conditions at the test fields during the growth period of the soybeans in 2016 and 2017.
Supplementary Table 3. Correlation coefficient values and p-values for agricultural performance of the 11 soybean varieties grown at the six experimental fields in 2016 and 2017.
Supplementary Table 4. Days to flowering (DTF), stem length (STL), days to maturity (DTM), 100-seed weight (HSW), and yield (YLD) of soybeans grown at the six experimental fields in 2016 and 2017.
Supplementary Table 5. Pearson's Correlation Coefficients (PCC) for each climatic condition and days to flowering (DTF), stem length (STL), days to maturity (DTM), 100-seed weight (HSW), and yield (YLD) of soybean varieties grown at six experimental fields in China and the Republic of Korea.
