INTRODUCTION
MATERIALS AND METHODS
Plant materials and Data collection
DNA extraction
SSR analysis
Analysis of population structure
RESULTS
SSR markers based analysis
Model-based population structure and hierarchical cluster analysis
AMOVA and PCoA of 2,016 rice accessions
DISCUSSION
INTRODUCTION
Rice (Oryza sativa L.) is an important cereal crop consumed exclusively by humans; it supplies staple food for nearly 50% of the global population (Garris et al., 2005). Researchers in many countries are interested in collecting rice germplasm because genetic rice resources, stored in gene banks throughout the world, could be valuable resources for bioindustry (Rutger et al., 1999). In Korea, the Rural Development Administration (RDA) Gene Bank maintains about 40,000 accessions of rice germplasm (http://www.genebank.rda.go.kr/). Although many RDA Gene Bank rice accessions and phenotypic characteristics have already been evaluated in the field of population diversity, there has been insufficient analysis of genetic diversity and relationship at the molecular level. In addition, most of the archived accessions have been utilized rarely or not at all in rice breeding programs.
The loss of genetic diversity in cultivated rice can have serious consequences for the crop from susceptibility to epidemic disease to the lack of evolutionary potential for adaptation to changing environments (Pusadee et al., 2009). To maintain genetic diversity in a rice germplasm, rice accessions with significant genetic variation should be included. In addition, it is necessary to investigate genetic diversity in the rice germplasm to broaden genetic variation in rice breeding because knowledge of germplasm genetic diversity is critical for utilization in crop improvement (Wang et al., 2013). In many previous researches, the genetic diversity of Korean rice germplasm has been performed using various molecular markers to provide useful guidelines for the strategic conservation and utilization of rice germplasm (Lee et al., 2015; Li et al., 2014; Wang et al., 2013; Zhao et al., 2009).
A clear understanding of genetic diversity is essential for effective conservation and utilization of genetic rice resources (Tu et al., 2007). Genetic diversity information provides opportunities for plant breeders to develop new and improved cultivars with desirable characteristics including farmer- preferred and breeder-preferred traits (Govindaraj et al., 2015). Molecular markers are used to assess genetic diversity and population structure to predict hybrid performance and heterosis because these markers are inherited guided by Mendelian rules and are not influenced by environmental factors (Kashiani et al., 2012; Legesse et al., 2007). Among many different molecular markers, simple sequence repeat (SSR) markers are the preferred choice for certain genetic studies because they can easily detect co-dominant alleles, are highly reproducible, and have very high levels of polymorphisms (Litt and Luty, 1989; Weber and May, 1989).
Genetic analysis is very important to ensure the success of preserving and utilizing plant germplasm in Korea’s RDA Gene Bank. In order to improve breeding material selection from the conserved germplasm of the gene bank, we evaluated a total of 2,016 rice accessions including Korean (KOR) landraces and cultivars, landraces from the People’s Republic of Korea (PRK), and major International Rice Research Institute (IRRI) rice accessions. Our main objectives were to investigate the genetic diversity of conserved Korean rice accessions using 12 polymorphic SSR markers, evaluate their population structures and clustering patterns, and survey the status of the conserved and utilized genetic diversity. These results will help to improve rice breeding programs and will be helpful for preserving and applying genetic rice resources in Korea.
MATERIALS AND METHODS
Plant materials and Data collection
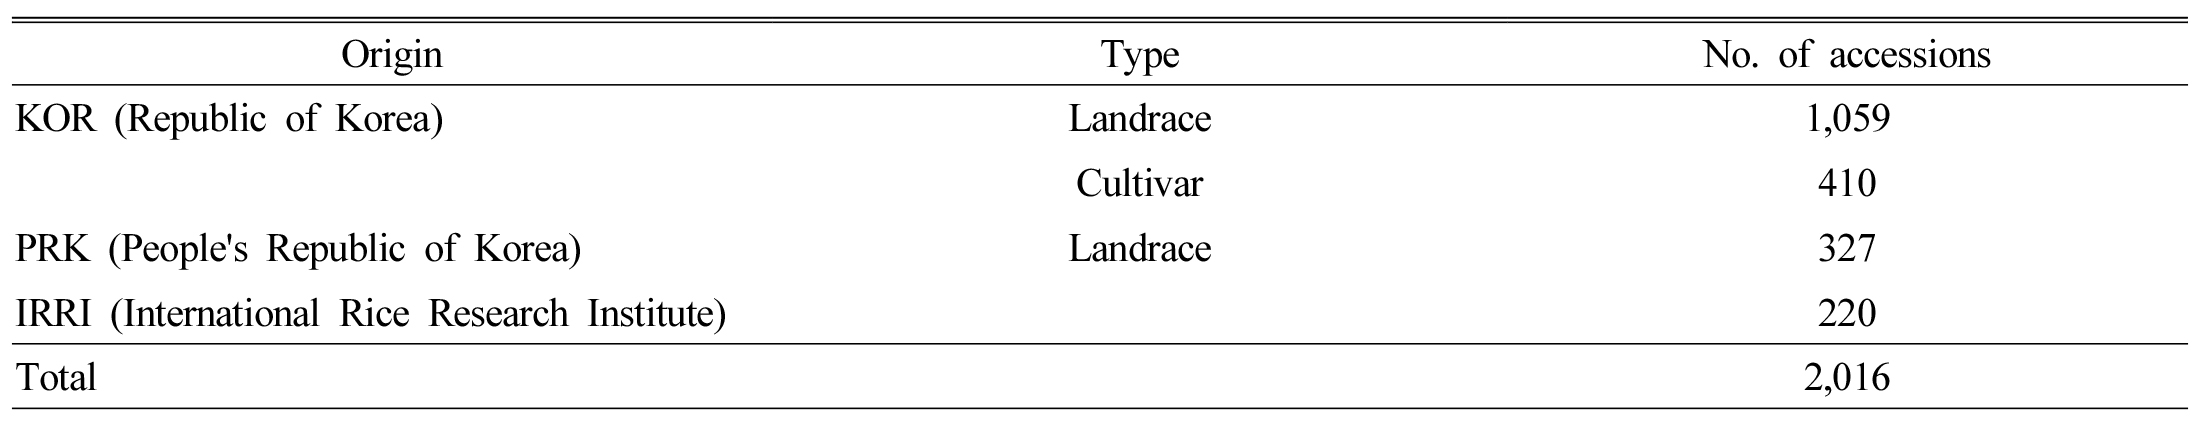
We obtained a total of 2,016 rice accessions (Table 1 and Supplementary Table 1) from the National Agrobiodiversity Center of the Rural Development Administration (RDA), Republic of Korea (http://genebank.rda.go.kr).
DNA extraction
We extracted total genomic DNA from young leaf tissue ground in liquid nitrogen using the modified CTAB method (Dellaporta et al., 1983). We determined DNA concentration and quality using a NanoDrop ND-1000 spectrometer (NanoDrop Technologies, Wilmington, DE, USA). We diluted DNA stocks to 20 ng/μl as working solutions.
SSR analysis
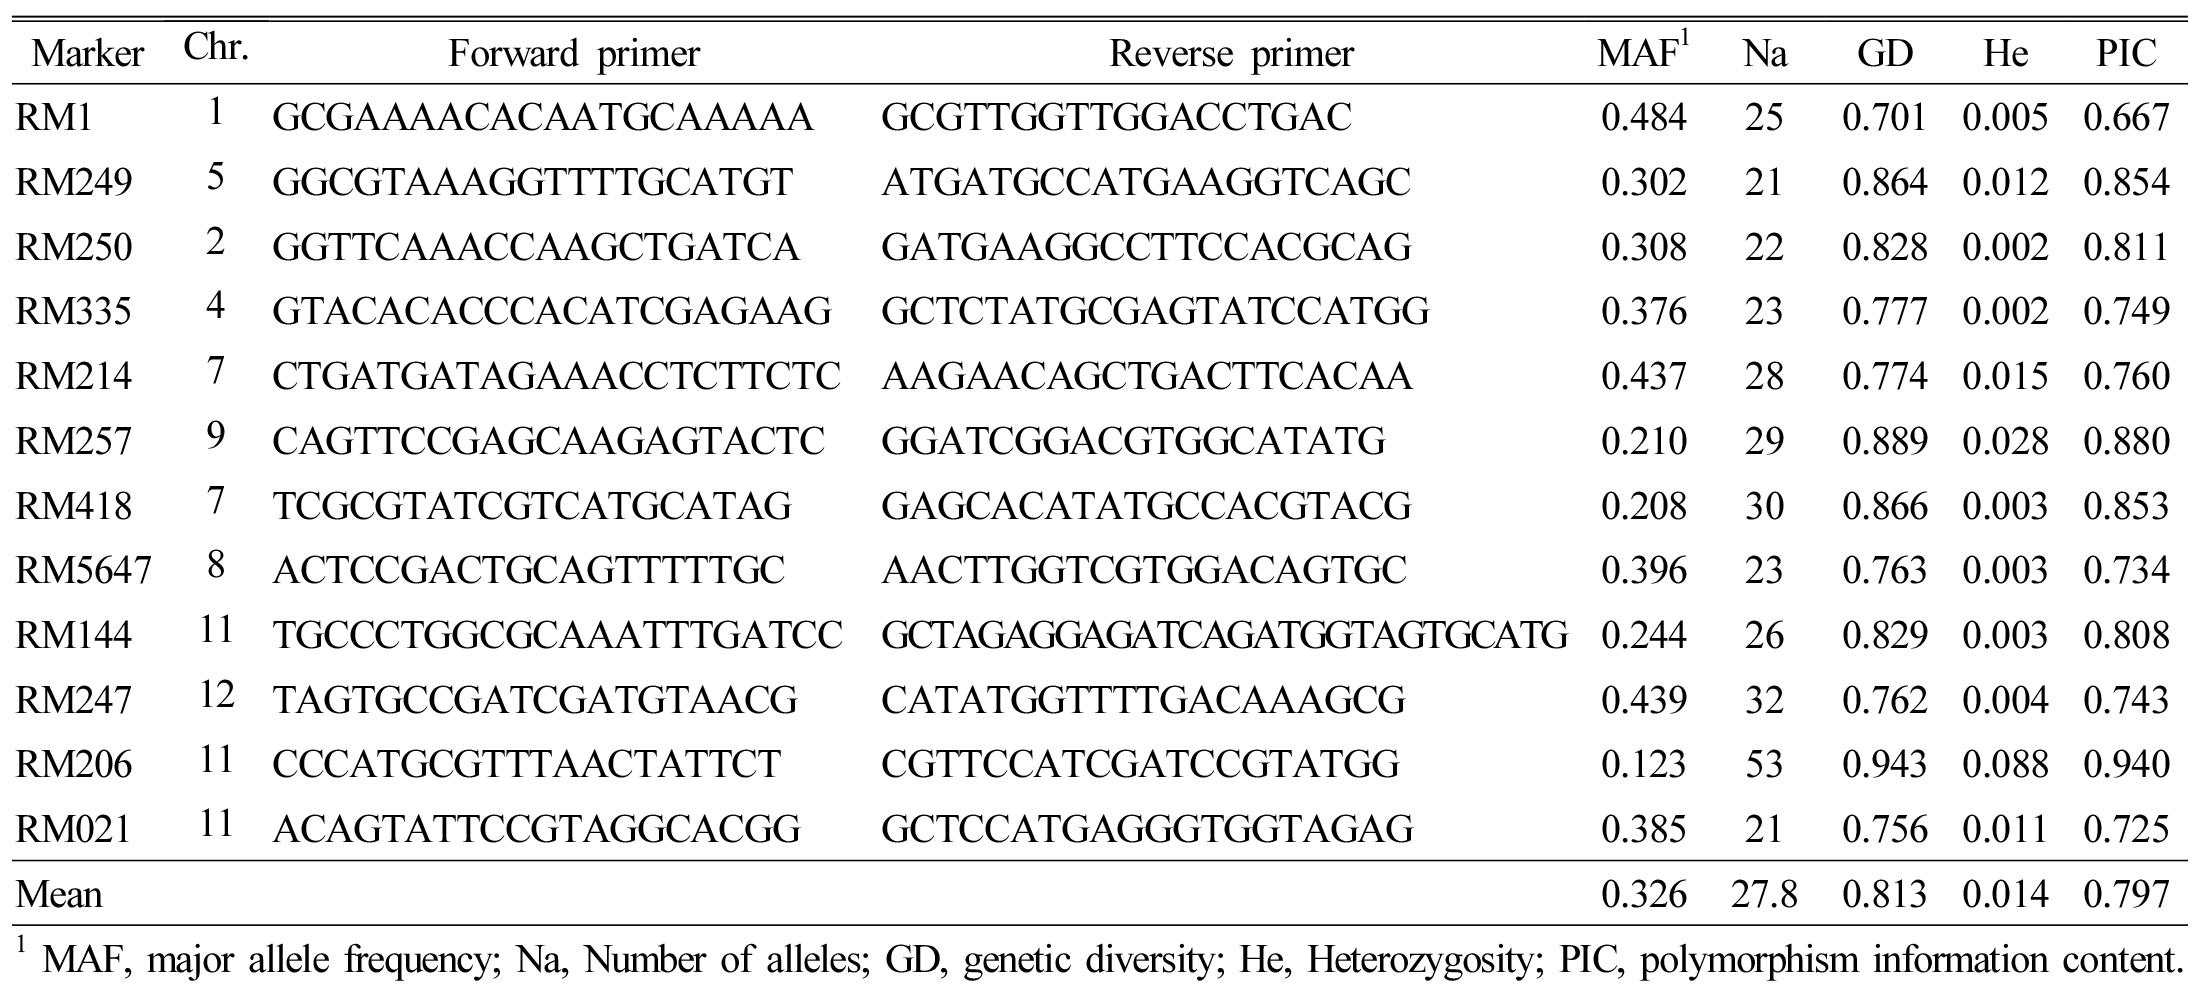
We chose markers according to their location on the rice genetic map and their suitability for high-throughput genotyping, using a total of 12 SSR markers (Table 1). We amplified the alleles in 20-μL volume containing 100 ng template DNA, 1×PCR buffer, and 0.2 mM each of dNTP, 1 U Taq DNA polymerase, and 2 pmol of reverse and forward primer, and we labeled the forward primers with different fluorescence: FAM, HEX, VIC, and NED. The published amplification conditions were: 94°C for 3 min, 30 cycles of 94°C for 30 s, 55°C (or other annealing temperature depending on the primer) for 45 s, 72°C for 1 min, and a final extension at 72°C for 10 min. We resolved SSR alleles using an ABI 3130xl Genetic Analyzer (Life Δ Technologies Corp., Carlsbad, CA, USA) with GeneScan 3.7 software. The alleles were sized precisely against 6-carboxy-X-rhodamine molecular size standards using Genotyper 3.7 software (Life Technologies Corp.).
Analysis of population structure
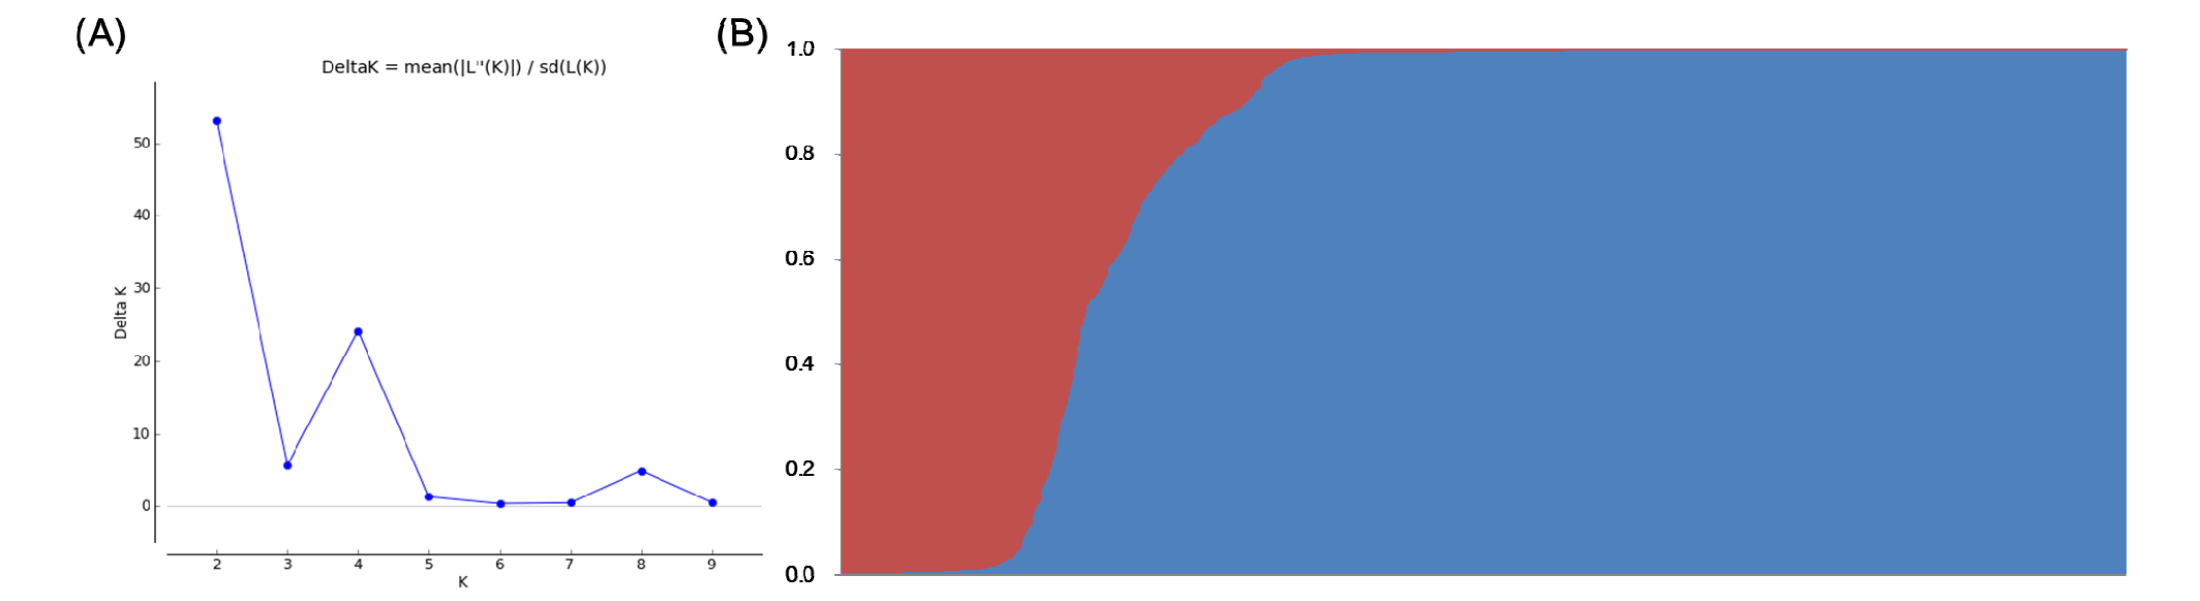
As an indicator of genetic diversity, we calculated major allele frequency (MAF), number of alleles (NA), genetic diversity (GD), expected heterozygosity (He), and polymorphism information content (PIC) using the genetic analysis package PowerMarker V3.25 (Liu and Muse, 2005). We constructed an unweighted neighbor joining tree using DARwin V6.0 and used structure V2.3.4 to detect possible subpopulations (K=1 to K=10) with a model that allowed for admixture and correlated allele frequencies using a burn-in period of 50,000 and MCMC repeats of 50,000 followed by three iterations (Pritchard et al., 2000). The optimal number of populations corresponds to the highest peak in the ΔK graph (Evanno et al., 2005), and we assigned the landraces with membership probabilities ≥ 70% to each subpopulation.
RESULTS
SSR markers based analysis
We used 12 SSR markers to characterize 2,016 rice accessions and calculated Na (the number of allele), GD (genetic diversity), He (heterozygosity), MAF (major allele frequency), and PIC (polymorphism information content) for all 12 markers. We amplified a total of 333 alleles with an average of 27.8 per locus (Table 2); Na amplified per SSR primer varied from 21 to 53, with the maximum number being amplified by primer, RM205 The PICs for the SSR markers ranged from 0.667 (RM1) to 0.940 (RM206) with a mean of 0.797; GD ranged from 0.701 (RM1) to 0.943 (RM206) with an average of 0.813; He varied from 0.002 (RM250 and RM335) to 0.088 (RM206) with an average of just 0.014; and MAF ranged from 0.123 (RM206) to 0.484 (RM1) with an average of 0.326.
Table 2. SSR primers used for genotyping the 2,016 rice accessions, No. of alleles amplified, gene diversity, heterozygosity, and PIC. |
|
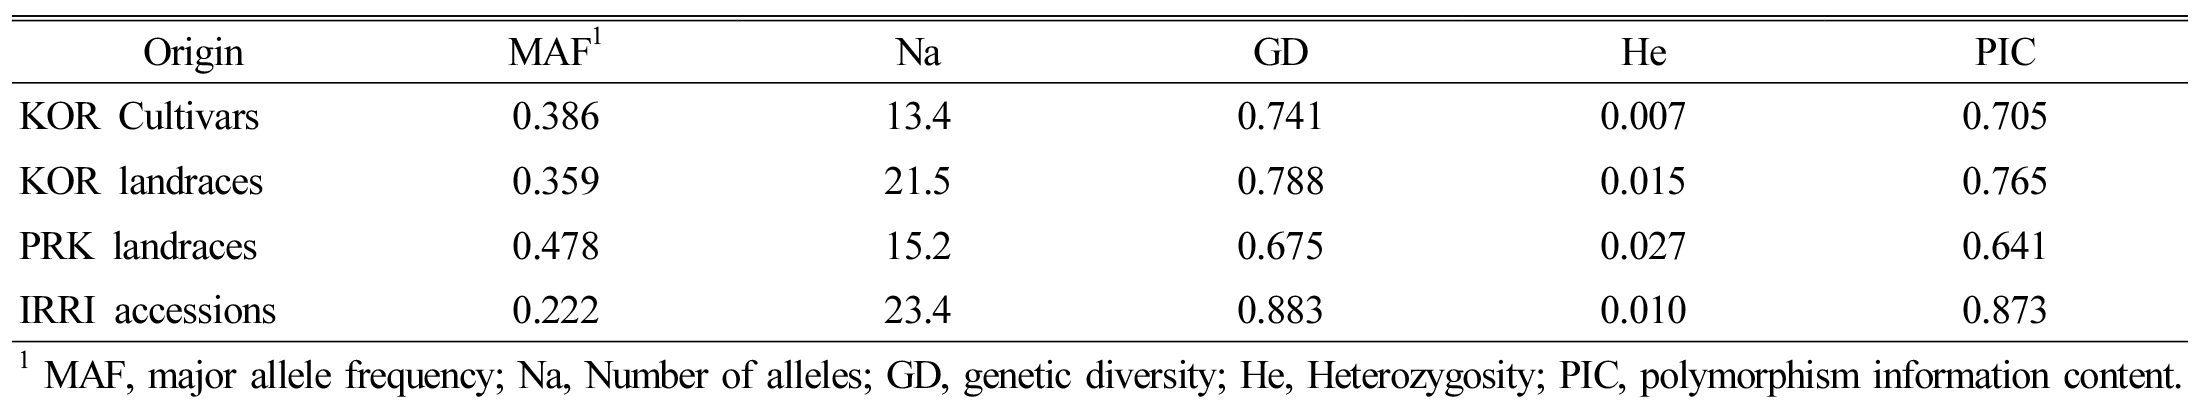
The numbers of alleles were 13.4, 23.4, 21.5, and 15.2 in the Korean cultivars (KC), Korean landraces (KL), PRK landraces (PL) and IRRA accessions (IA), respectively (Table 3). The PICs for KC, KL, PL, and IA were 0.705, 0.765, 0.641, and 0.873, respectively. The GD and He of KC, KL, PL, and IA were 0.741, 0.788, 0.675, and 0.883 and 0.007, 0.015, 0.027, and 0.010, both respectively. The MAFs of KC, KL, PL and IA were 0.386, 0.359, 0.478, and 0.222, also respectively.
Model-based population structure and hierarchical cluster analysis
We used the amplicons generated by 12 SSR markers across 2,016 accessions to analyze model-based population structure and hierarchical clusters, and the inferred population structure and unrooted neighbor joining (NJ) tree (Fig. 1 and Fig. 2) among the 2,016 accessions revealed that there might be two main group and five groups, respectively, that were divergent.
Based on the inferred population structures (Fig. 1), population1 (pop1) and population2 (pop2) contained 383 and 1,633 accessions, respectively. Pop1 contained 65 Korean cultivars, 205 IRRI accessions, 103 Korean landraces, and 10 PRK landraces, and Pop2 consisted of 339 Korean cultivars, 97 IRRA accessions, 887 Korean landraces, and 310 PRK landraces. Further, based on the membership fractions, we categorized rice accessions under different populations as pure or admixture; we considered the accessions with probability greater than ≥ 0.80 to be pure and less than 0.80 as an admixture. Pop1 showed 326 pure (85.1%) and 57 admixed (14.9%) individuals, and pop2 showed 1,482 pure (90.8%) and 151 admixed (9.2%) individuals.
Among five clusters by cluster analysis, Cluster I comprised of IRRI rice accessions, whereas clusters II and III consisted of almost Korean rice landraces. Clusters IV and V were mixed Korean cultivars and landraces and PRK landraces. All rice accessions in cluster I had population structure pop1, and clusters II, III, IV, and V were in pop2.
AMOVA and PCoA of 2,016 rice accessions
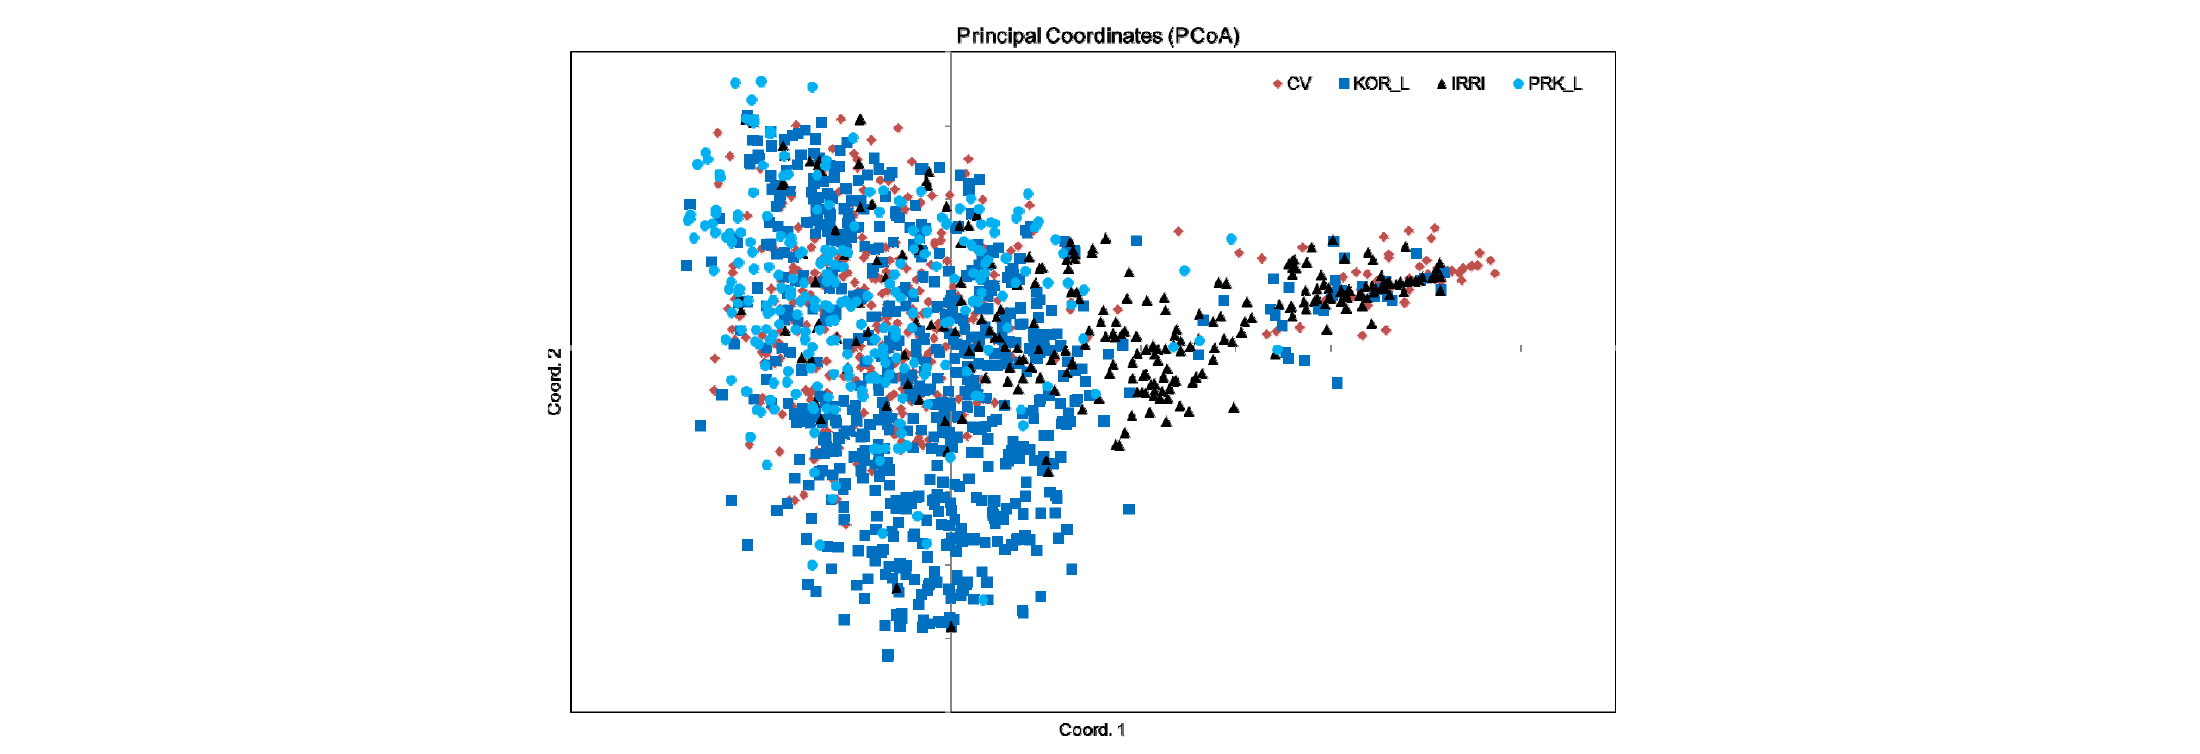
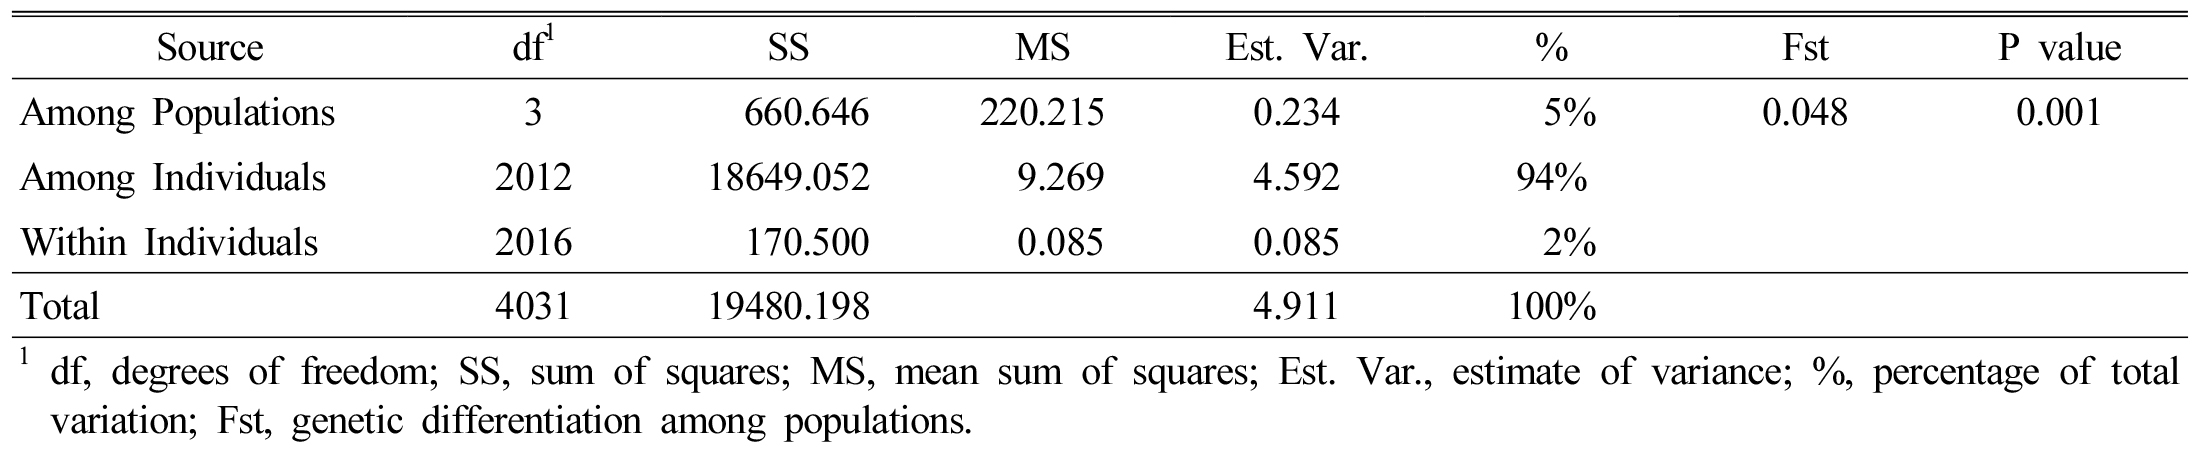
We performed analysis of molecular variance (AMOVA) for the 2,016 rice accessions based on the 12 SSR markers. The four populations (origins KC, KL, PL and IA) showed 5% variance among themselves, but we recorded 93% variance among individuals and 2% variance within individuals (Table 4). Principal coordinate analysis (PCoA) based on the 12 SSR markers showed intermixing of four groups across the coordinates (Fig. 3). The first three axes explained 17.3% of the cumulative variance (Table 5).

DISCUSSION
Erosion of plant genetic diversity is a very serious problem caused by modernization and replacement of wild plants or landraces with a few elite varieties (van de Wouw et al., 2010; van Heerwaarden et al., 2009). Therefore, collecting and preserving genetic plant resources is increasingly important for crop breeding to support the demands of a growing human population. Effective management and utilization of these resources requires information about strain origins, phenotypic traits, and genetic background, which can be identified by molecular techniques (Kim et al., 2017). In this study, we analyzed genetic diversity among rice accessions collected from several regions and conserved in Korea’s RDA Gene Bank; genetic diversity is the raw material that spurs genetic improvement, both to increase yield potential per se (i.e., production per unit area) and to decrease reliance on production inputs. Genetic crop diversity ensures future genetic progress and is insurance against unforeseen threats to agricultural production such as disease epidemics or climate changes. Thus, the fate of genetic diversity in these gene pools is of great important if plant breeding will continue to address the pressing needs of society such as increased yield, genetic resistance to diseases and pests, improved nutritional and processing quality of crop products, and fewer environmental effects (Gepts, 2006).
Our results revealed a high mean number of alleles per locus (27.8) and a high PIC (0.797; Table 1), and these values were higher than those from other studies of genetic rice diversity. Previous research reported on numbers of alleles: 3.11 alleles per locus and 0.29 PICs for 729 rice varieties (Singh et al., 2016), 4.80 alleles per locus and 0.50 PICs for 82 rice genotypes collected from different parts of Asian countries (Babu et al., 2014), 3 alleles per locus and 0.468 in a set of 192 Indian rice germplasm (Nachimuthu et al., 2015), and 9.65 alleles per locus and 0.58 PICs for 76 Korean rice germplasm (Lee et al., 2015). Although the numbers of individuals, markers, and material types differed among the other studies, we concluded that the conserved Korean accessions in Korea’s RDA Gene Bank are relatively diverse; in particular, the Korean landraces and major IRRI accessions showed more genetic variability than did the Korean cultivars and PRK landraces in a view of alleles, genetic diversity, and PICs (Table 2).
Analyzing genetic diversity and population structure in germplasm is very important for identifying potentially valuable resources (Wang et al., 2008). In this study, we used two methods to evaluate population structure, model-based clustering and neighbor joining. The model-based clustering using STRUCTURE revealed a maximum ΔK of K=2 based on the statistical method described by Evanno et al. (2005). In addition, we phylogenetically analyzed the used rice accessions by NJ (Fig. 1 & Fig. 2). Overall, we detected two main groups in population structure and cluster analysis that could be subdivided into five clades; however, the patterns of population structure calculated by the two methods did not clearly distinguish among four origins. In general, population structures and clustering patterns are influenced by many different factors, such as the natural history of a population, breeding systems, complexity of breeding practices, and human selection (Xie et al., 2008). We found Korean cultivars located in narrow clades on the NJ tree among the diversity of South and North Korean landraces, and these revealed alleles that were being utilized for a breeding program and were restricted to limited accessions.
Analysis of molecular variance showed more variability, 93%, among the individuals than among populations or within individuals (Fig. 2), and because the variation among the individuals was greater, it is important to conserve and utilize as many rice accessions population as possible. This result was similar to the findings from previous reports by (Hassan et al., 2012; Saini et al., 2004), who obtained 91.2% and 91% variation among the individuals and within their study populations, respectively.
In conclusion, for this study, we surveyed the genetic diversity and analyzed the population structures and phylogenetic relationships primarily among the Korean rice accessions conserved in the country’s RDA Gene Bank. The average numbers of alleles per locus and gene diversity indicated the existence of a broad genetic base in this rice germplasm, and the STRUCTURE analysis results accorded with the neighbor joining tree and principal coordinate analysis clustering methods. These results revealed that the preserved diversity in Korean landraces could be useful for breeding new rice cultivars and the basis for the sustainable conservation and utilization of Korean rice germplasm.