

INTRODUCTION
MATERIALS AND METHODS
Mung bean flour sample preparation
Chemicals
Sample extraction, analysis and quantification
Statistical analysis
RESULTS AND DISCUSSIONS
Composition and content of mung bean according to cultivation regions
Composition and content of mung bean according to seeding dates
CONCLUSION
INTRODUCTION
Mung bean (Vigna radiata L.) is a familiar food ingredient that is widely used in the body as a nutritional supplement. It is cultivated in Southeast Asia, including Korea, China, India and Thailand. Mung beans have strong drought resistance and grow well in warm climates. Since mung bean is not long-growing, it can be grown in highland or high latitude regions. It is also known that the period of sowing is longer than that of soybeans or red beans. Mung bean is an increasingly important human food source because of its powerful antioxidant (Kim et al., 2005). In Korea, the mung bean is utilized in various ways such as mung bean pancake, mung bean sprout, mung bean jelly and mung bean porridge and used as a medicine in India (Kim et al., 1981). Mung bean is similar in constituent to other members of the legume, with 63% carbohydrate, 16% dietary fiber, 24% protein and 1% fat. Most previous studies focused mainly on primary metabolites such as carbohydrates and proteins (Kim et al., 2005). The object of this study was to research the differences in the content of mung bean on the secondary metabolites according to the cultivation regions and seeding dates.
The mung bean is known to be rich in vitamins, minerals, and essential amino acids compared to soybean and kidney bean, also contain large amounts of functional ingredients such as flavonoids and phenolic compounds. Phenolic compounds, found in mung bean, are secondary metabolite that synthesized through the pentose phosphate pathway, the shikimate pathway and the phenyl-propanoid pathway (Randhir et al., 2004). These compounds have an aromatic ring with at least one hydroxyl group (Balasundram et al., 2006). Phenolic acids represent the most common form of phenolic compounds and constitutes one of the major and most complex groups of phytochemicals in grains (Yao et al., 2013). The beneficial effects derived from phenolic compounds are due to antioxidant activity (Heim et al., 2002). Phenolic compounds can be a major determinant of food antioxidnt potential (Parr & Bolwell, 2000). So they can be a natural source of antioxidants in foods (Balasundram et al., 2006).
The metabolism, quantity and quality of the fatty acids in the diet are important for health and disease. The main fatty acids of legumes are generally palmitic acid, oleic acid, linolenic acid, and linoleic acid (Anwar et al., 2007). Fatty acids can be divided into short chain (2-8), medium chain (8-12) and long chain (13-24), depending on whether they are double bonds or saturated, monounsaturated and polyunsaturated fatty acid (SFA, MUFA and PUFA) (Kostik et al., 2013). Highly unsaturated fatty acids such as PUFA, linoleic acid and α-linolenic acid, are essential fatty acids that can not be synthesized and are important for human metabolism, which must be ingested through the diet and have a beneficial effect on health (Parikh et al., 2005). Lack of essential fatty acid is associated with the causes of disease such as cardiovascular disease (Brown, 2005).
Soyasaponins consist a group of structurally diverse compounds containing triterpenoid aglycone in legumes (Price et al., 1986). Soyasapogenol, the aglycone of soyasaponin, is classified as soyasapogenol A and B, according to their structures (Kim et al., 2012). Soyasaponin is considered to be a diverse group of bioactivities and functional compounds (Yoshiki et al., 1998). Soyasaponin B group is the most commonly found in legume (Murphy et al., 2008). This soyasapogenol B has a variety of physiological activities such as inhibition of platelet aggregation, anti-tumor activity, anti-complement activation and hepatoprotective effect (Kostik et al., 2013). An efficient analytical method was used utilizing high-performance liquid chromatography (HPLC) / evaporative light scattering detector (ELSD) to separate and quantify triterpene soyasapogenol A and B in mung beans (Rupasinghe et al., 2003). The ELSD is based on the light scattering by the nebulized solutes sprayed without absorption by the analytes (Rupasinghe et al., 2003).
Tocopherol, mostly known as vitamin E, is include in food as four types of α, β, γ, and δ-tocopherol. An important function of tocopherol in the human body is to inhibit lipid oxidation by antioxidant to prevent cell membrane damage and tissue damage (Kim et al., 2015). Tocopherols found in mung bean were δ- tocopherol and γ-tocopherol, which exhibited potent antioxidant activity, and the γ-tocopherol was especially high (Rossell & Pritchard, 1991). Grain usually contains a moderate amount of tocopherol, but it is a important source of tocopherol because of the high consumption of mung bean in Korean diets (Choi et al., 2007). Previous studies have shown that mung beans are a particularly important source of tocopherols (Anwar et al., 2007).
In the past, studies were mainly conducted on the cultivation of mung bean. The study was made on the growth and yield of mung bean (Hyon et al., 1992). However, there are few studies on the content of functional materials of mung bean according to cultivation regions and seeding dates.
In this study, three regions of Suwon, Jeonju and Pyeongchang and two seeding dates of June and July were selected. The reason is that the main cultivation of mung bean is in the south, but the cultivation region is heading north due to climate warming. This work was conducted to obtain basic data for cultivation with a high contents of various functional materials as regional specialization at the optimal time.
MATERIALS AND METHODS
Mung bean flour sample preparation
Mung bean flour were obtained from the Rural Development Administration (RDA, Jeonju, Korea) in 2017. In this study, three cultivars were used that names are “Sohyeon”, “Dahyeon”, “Jangan”. Comparisons of the contents according to the cultivation regions were used “Suwon”, “Jeonju” and “Pyeongchang” samples of “Sohyeon” and “Dahyeon” cultivars. Also, comparisons of the contents according to the seeding dates were used “June” and “July” samples of “Sohyeon”, “Dahyeon” and “Jangan”. Before and after experiment time, all of the samples were stored in a desicator(room temperature, humidity:<15~20%).
Chemicals
All chemicals used in the extraction and analysis of phenolic compounds, fatty acids, soyasapogenol and tocopherols were HPLC grade. Ethanol (EtOH), methanol (MeOH), acetonitrile (ACN), iso-octane were purchased from Thermo Fisher Scientific (Thermo Fisher Scientific, Waltham, MA, USA). Formic acid, heptane, potassium hydroxide (KOH) and benzene were purchased from Junsei (Junsei, Chuo-ku, Tokyo, Japan). Dimethyl sulfoxide, 2.2-dimethoxypropane and dichloromethane were purchased from Sigma-Aldrich Co (Sigma-Aldrich Co, St. Louis, MO, USA). Acetic acid, 6N-HCl and 0.1N-HCl were purchased from Daejung Chemical and Materials Co. Ltd (Daejung Chemical and Materials Co. Ltd, Shiheung, Gyeonggi- Do, Korea). Ascorbic acid was obtained from Samchun Chemical Co. Ltd (Samchun Chemical Co. Ltd, Gangnam-gu, Seoul, Korea) and 1-propanol from Wako Pure Chemical Industries, Ltd (Wako Pure Chemical Industries, Ltd, Chuo-ku, Osaka, Japan).
The selected fifty-seven phenolic compound standards (STDs), two soyasapogenol STDs and four tocopherol STDs, were obtained from Sigma-Aldrich Co (Sigma-Aldrich Co, St Louis, MO, USA). Also, The thirty-seven component fatty acid methyl ester (FAME) standard mixture and pentadecanoic acid, used as an internal standard, were obtained from Sigma-Aldrich Co (Sigma-Aldrich Co, St Louis, MO, USA).
Sample extraction, analysis and quantification
Extraction of phenolic compounds
The extraction of phenolic compounds from mung bean flour was performed using acidic extraction method (Wang & Murphy, 1996). Finely ground sample powder 1 g of mung bean flour was weighed, then added 10 ml of acetonitrile and 2 ml of 0.1 N hydrochloric acid. And each sample was shook in shaker from Green-Seriker (Vision Scientific Co., Ltd., Yuseong-gu, Daejeon, Korea) of 200 rpm for 2 h. After shaking, the extract was filtered with whatman No.42 filter paper (110 mm diameter) and evaporated below 35°C using a rotary evaporator from EYELA SB-1200 (Tokyo Rikakikai Co, Hiratsuka, Japan). The residue was redissolved with 5 mL of 80% methanol and filtered with a 0.22µm PTFE syringe filter.
LC-MS/MS for analysis of phenolic compounds
Phenolic compounds in mung bean flour samples were analyzed by high-performance liquid chromatography (HPLC) – electrospray ionization (ESI) – tandem mass spectrometry (MS/MS). The HPLC System (Agilent Co. Ltd., CA, USA) consisted of a 1290 Binary Pump with Degasser (G4220A), an 1100 Series Column Compartment (G1316A) and an 1100 Series Autosampler (G1313A). The HPLC column for substance separation of phenolic compounds was C18 Thermo Syncronics (150 x 4.6 mm, 5 µm). The mobile phase was composed 0.1% formic acid in deionized water (solvent A) and 0.1% formic acid in acetonitrile (solvent B). The gradient for mobile phase was as follows: 0 min, 90% A 10% B; 10 min, 60% A 40% B; 20 min, 50% A 50% B; 25 min, 0% A 100% B; 26 min-30 min, 90% A 10% B for re-equilibrium. The flow rate was 0.5 ml/min and an aliquot of 10 μL was injected and each sample was analyzed intriplicate. The temperature of column was set at 25°C.
Mass spectra of an API 2000 system equipped with an electrospray ionization (ESI) source and a triple-quadrupole mass spectrometer (MS/MS) (AB Sciex, Framingham, MA, USA). The MS/MS and ESI source were operated in multiple reaction monitoring (MRM) and negative ion mode. The optimum ESI parameters were set by flow injection analysis (FIA). They were as follow: curtain gas (CUR) 50 psi, collision gas (CAD) 2 psi, ion-spray voltage (IS) -4400V, ion spray probe temperature (TEM) 500°C, nebulizer gas 40 psi, heater gas 50 psi, and interface heater was turned on. Nitrogen gas was used as collision, heater, nebulizer and curtain gas. The area of ion spray probe was set to 5 mm in horizontal and 3 mm in vertical axis. The optimum MRM parameters of each targeted compounds were set by the infusion of corresponding standard solution.
Determination of phenolic compounds were based on comparing retention time (RT) and mass to charge ratio (m/z) values of precursor and product ions (Q1 and Q3 values) with equivalent standard solutions. The standards of phenolic compounds were dissolved with the adequate solvents depending on their solubility properties for making stock solutions. The standard solutions were diluted with 80% methanol for calibration curve. Data acquisition and processing for establishing calibration curve and quantitation were performed using Analyst software (version 1.6.2; AB sciex, USA). The limit of quantitation (LOQ) and the limit of detection (LOD) were calculated with the signal-to-noise (S/N) ratio (level of 3 and 10).
Extraction of fatty acid
Transesterification was performed to convert the FAs in the mung bean flour to FAME ahead of gas chromatography composed to flame ionization detector (GC-FID). Before analysis, 50 mg of mung bean flour samples were put in amber vials with 0.2 mg of pentadecanoic acid as the internal standard. And then, 400 μL of heptane and 680μL methylation mixture composed of MeOH / Benzene / Dimethoxypropane / H2SO4 = 19.5 : 10 : 2.5 : 1 (v/v/v/v) were put into samples. Each sample was shook for 2 hours at 80°C in a water bath (BioFree Co. Ltd., Korea). After then, the samples were cooled down at the room temperature and the supernatants were put into micro centrifuge tube, centrifuged for 1min. They were put in a 300 μL insert in the amber vials (Chung et al., 2017; Garcés & Mancha, 1993).
GC-FID for analysis of fatty acid
The fatty acid was analyzed by GC-FID system Agilent 7890 B (Agilent Co. Ltd., CA, USA). To separate the 37 FAMEs, a capillary column (HP-INNOWAX 19091N, 0.25 mm × 30 m, 0.25 μm, Agilent Co. Ltd, CA, USA) was used. The helium carrier gas was set at 10 mL/min, the hydrogen flame gas was set at 35 mL/min and the mixed gas set at 300 mL/min. The initial oven temperature was set at 100°C for 2 min, 150°C (5°C·min-1) for 2 min and 240°C (5°C·min-1) for 5min. The FID temperature was 250°C and inlet temperature was 230°C. The volume of injection was 1μL with 1:50 split mode. Total analysis time of fatty acid was 64 min (Chung et al., 2017).
tandard mixture were mixed as stock solution. Each FAs in the sample was analyzed by comparing retention time with 37 standard mixture and spike test was done for exact peak assignment.
Extraction of soyasapogenol
The soyasapogenols A and B were extracted and analyzed with the method of (Rupasinghe et al., 2003). Each 0.2 g of mung bean flour samples were extracted in 30mL of 80% ethanol and shook in a water bath/shaker at 50°C for 2 h. After that, the samples were centrifuged at 3000 rpm, 4°C for 5 min VS-6000FN (Vision Scientific Co. Ltd., Yuseong-gu, Daejeon, Korea) and 15 mL of the supernatant put into a 100 mL round- bottom flask. Then, the solvent was vaporized using a rotary vacuum evaporator at below 40°C. The residue in flask was redissolved with 8 mL of 1N HCl in MeOH. The sample was moved to a screw-capped glass vial and shook in a water bath/shaker at 80°C for 2 h 30 min to carry out acid hydrolysis to release soyasapogenol from the soyasaponins. The solution used a solid phase extraction method to selectively extract the desired components. The solution was put in a C-18 Sep-Pak cartridge (Waters Corp, Milford, MA, USA) and washed with 4 mL of distilled water and 100% methanol. Then, solution was poured into cartridge and washed one more time with 5 mL of distilled water and 100% methanol. Finally, the eluent was filtered with a 0.45 μm nylon syringe filter and inserted in screw vials.
HPLC/ELSD for analysis of soyasapogenol
The soyasapogenol analysis was determined by ELSD system that consisted of an Alltech 2000 ES evaporative light scattering detector (ELSD; Alltech Associates, IL, USA), equipped with TSP AS 1000 auto injector (Thermo Fisher Scientific, Waltham, MA, USA) and ACME 9000 pump with Solvent degasser & valve module (Young-Lin Co, Anyang, Gyeonggi-Do, Korea). Separation of soyasapogenol A and B used by an ODS C18 column (YMC-pack, 4.6 X 250 mm I.D.). The mobile phase was composed of acetonitrile / deionized water / 1-propanol / 0.1% aceticacid = 80 : 13.9 : 6 : 0.1 (v/v/v/v). Nitrogen gas was used as nebulizer gas (2 mL/ min), and the temperature of the drift tube was set at 70°C. The analysis time was 28 min and the flow rate was 0.9 mL/min.
The standards of soyasapogenol A and B were dissolved in methanol at appropriate concentrations ( soyasapogenol A; 2.5, 12.5, 20, 25μg/ mL soyasapogenol B; 5, 7.5, 10, 15μg/mL) for calibration curve. The soyasapogenol was identified by comparing retention time and STDs spiking test.
Extraction of tocopherol
Tocopherols were extracted and analyzed using the preceding study (Kim et al., 2005). 1g of samples and 0.1g of ascorbic acid were extracted in 20 ml of ethanol using a water bath/shaker at 80°C for 10 min. After then, 300 μL of KOH was added for saponification and mixed in a water bath/shaker at 80°C for 18 min. The samples were cooled in ice for 15 min. 10 mL of hexane and water were added to samples and centrifuged at 3000 rpm, 4°C for 5 min. The hexane layer was collected and the sample was centrifuged again by the addition of 10 mL hexane. This process was repeated triplicate. The 30 mL of hexane layer were washed with 5 mL of distilled water at two times and centrifuged at 3500 rpm, 4°C for 10 min. To remove any moisture, hexane layer was filtered with a sodium sulfate (Na2SO4). Finally, the solvent was evaporated by rotary vacuum evaporator. The residue was redissolved in 1 mL of iso-octane.
GC-FID for analysis of tocopherol
The tocopherols of mung bean flour analyzed by the GC-FID system (Agilent 7890 B, Agilent Co. Ltd, CA, USA). The GC column for substance separation of tocopherols was a capillary column (CP-SIL 8 CB, 0.32 mm × 50 m, 0.25 μm) was used. The inlet temperature was 290°C and the temperature of the GC oven was 220°C for 2 min, 290°C (5°C·min-1) for 14min and 300°C (10°C·min-1) for 10 min (Kim et al., 2015).
The 4 standards of tocopherol (α, β, γ, δ – tocopherol) were dissolved in iso-octane at 1000 μg/mL as stock solution. Each standard solution was diluted to make the calibration curve. The tocopherols were identified by comparing retention times and STDs spiking test. All calibration curves have high linearity (R2≥0.99). Inaddition, limit of quantification (LOQ) and limit of detection (LOD) were calculated using calibration curves as follow; LOQ=10×SD/S, LOD=3×SD/S.
Statistical analysis
In this study, mung bean flour preparation was conducted in triplicate, and the experimental design was completely randomized. The statistical analysis was performed by the SAS software (version 9.4; SAS Institute, Cary, NC, USA). The least significant difference (LSD) and the general linear model (GLM) test were used to analyze data and performed at the 0.05 probability level. In addition, Pearson’s correlation analysis was conducted the relationship between the variety and cultivation region or variety and seeding dates.
RESULTS AND DISCUSSIONS
Composition and content of mung bean according to cultivation regions
Among the phenolic compounds of 57 kinds, 12 kinds of phenolic compounds (gallic acid, gentisic acid, p-coumaric acid, protocatechuic acid, p-hydroxybenzoic acid, salicylic acid, caffeic acid, rutin, luteolin, orientin, vitexin, isovitexin) were detected. The MS spectra and fragmentation scheme of representative phenol compounds are shown in Fig. 1.
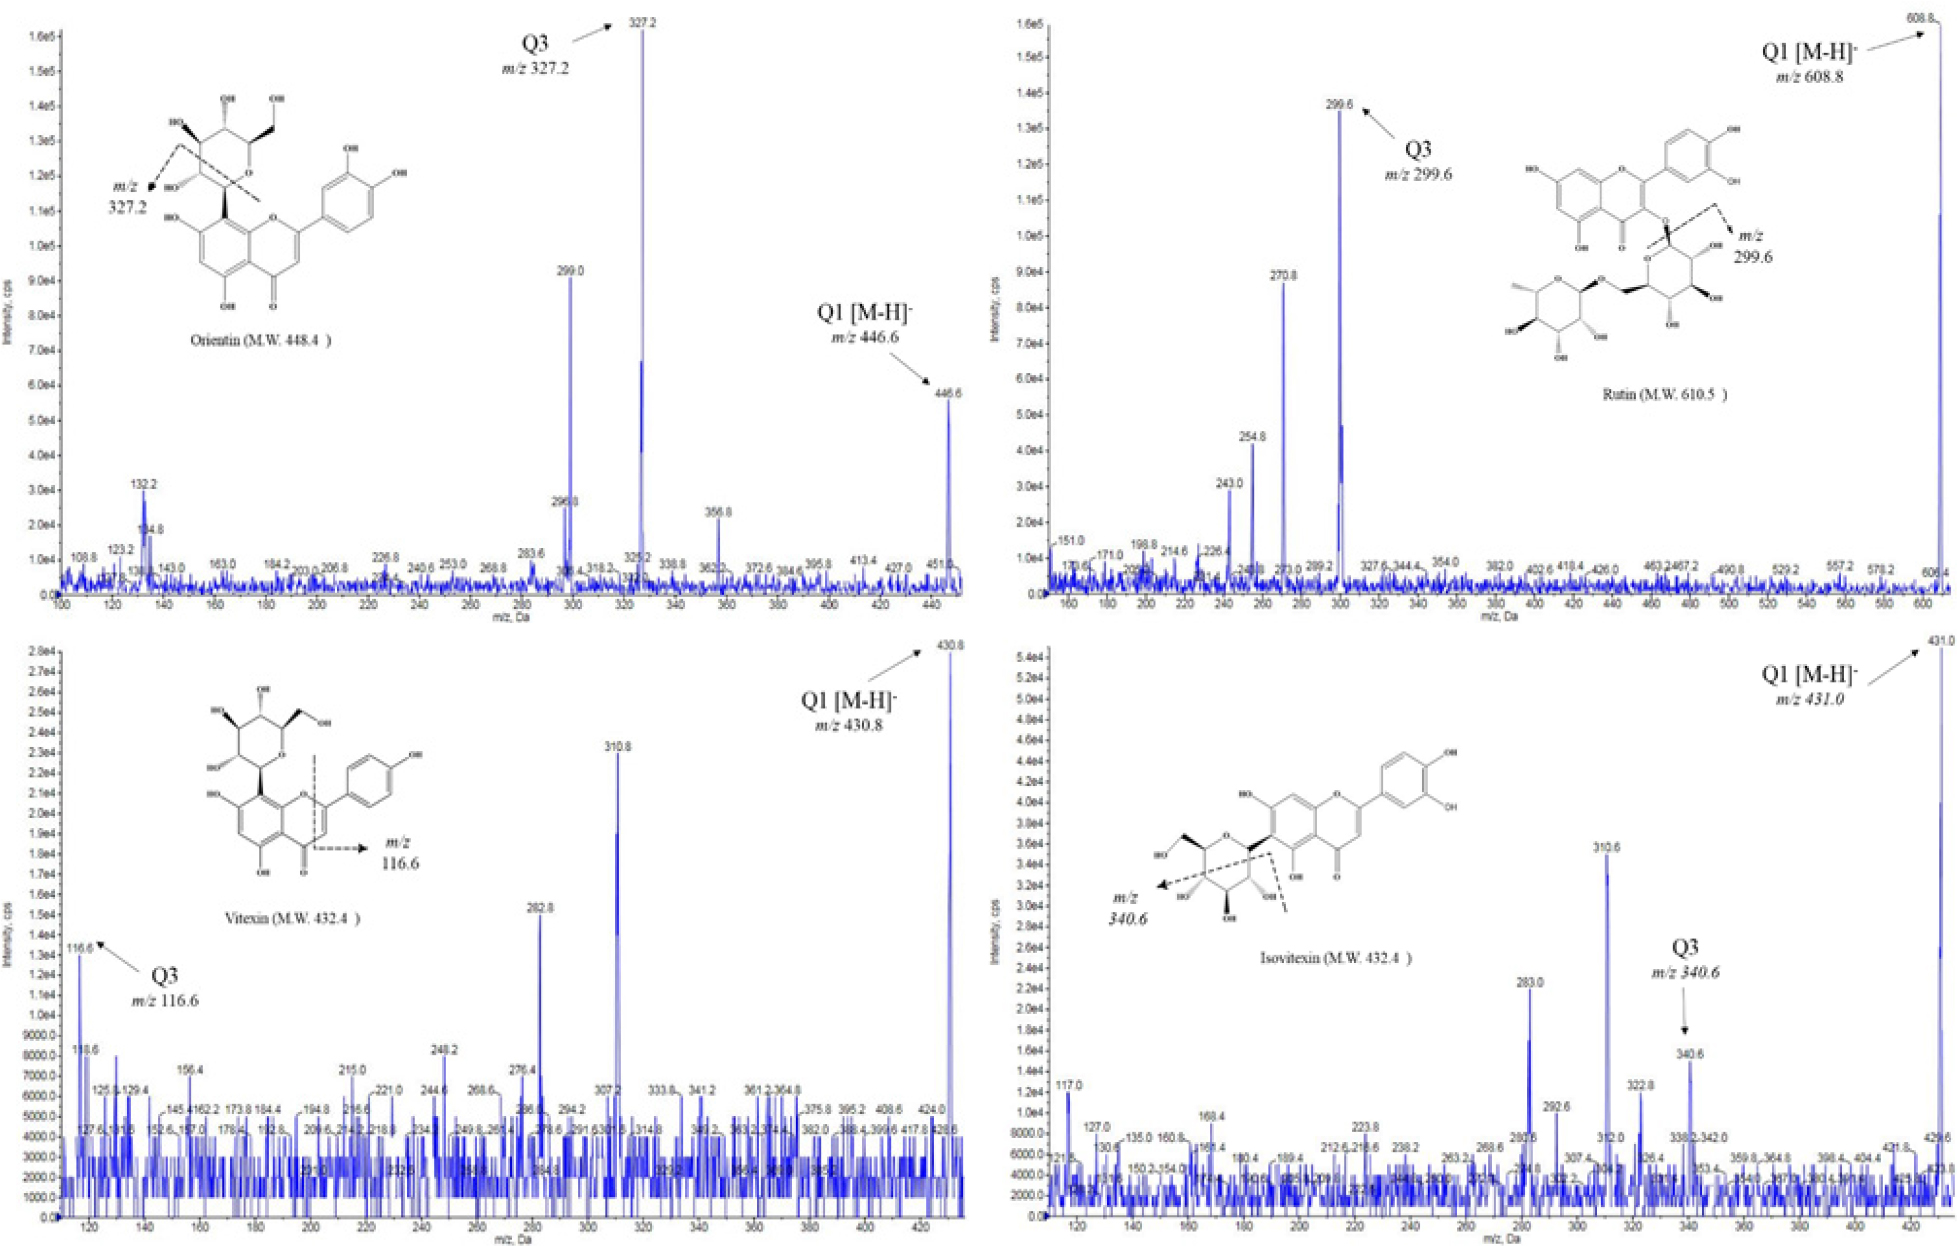
The composition of phenolic compounds in mung bean according to cultivation regions are shown in Table 1. Of these, vitexin (2308.39 ± 112.66 μg/g to 2792.23 ± 506.10 μg/g) and isovitexin (1478.10 ± 81.31 μg/g to 1718.42 ± 273.70 μg/g) were the most abundant compound, accounting for about 99% of phenolic compounds. They were the result of quantification after re-analysis by diluting 100 times. Orientin (14.50 ± 2.25 μg/g to 17.63 ± 1.36 μg/g) and rutin (1.76 ± 0.03 μg/g to 3.12 ± 0.15 μg/g) were the next most abundant compounds after vitexin and isovitexin. When comparing to the cultivation region, the total phenol content of Pyeongchang was the highest in Sohyeon at 4535.21 ± 779.79 μg/g (Fig. 2) But, Sohyeon was not statistically significant in according to cultivation regions. On the other hand, Dahyeon showed differences in total phenol compounds in Suwon, Jeonju and Pyeongchang (p < 0.05).
Table 1.
Composition of phenolic compounds in mung beans according to cultivation regions (μg/g dry weight).
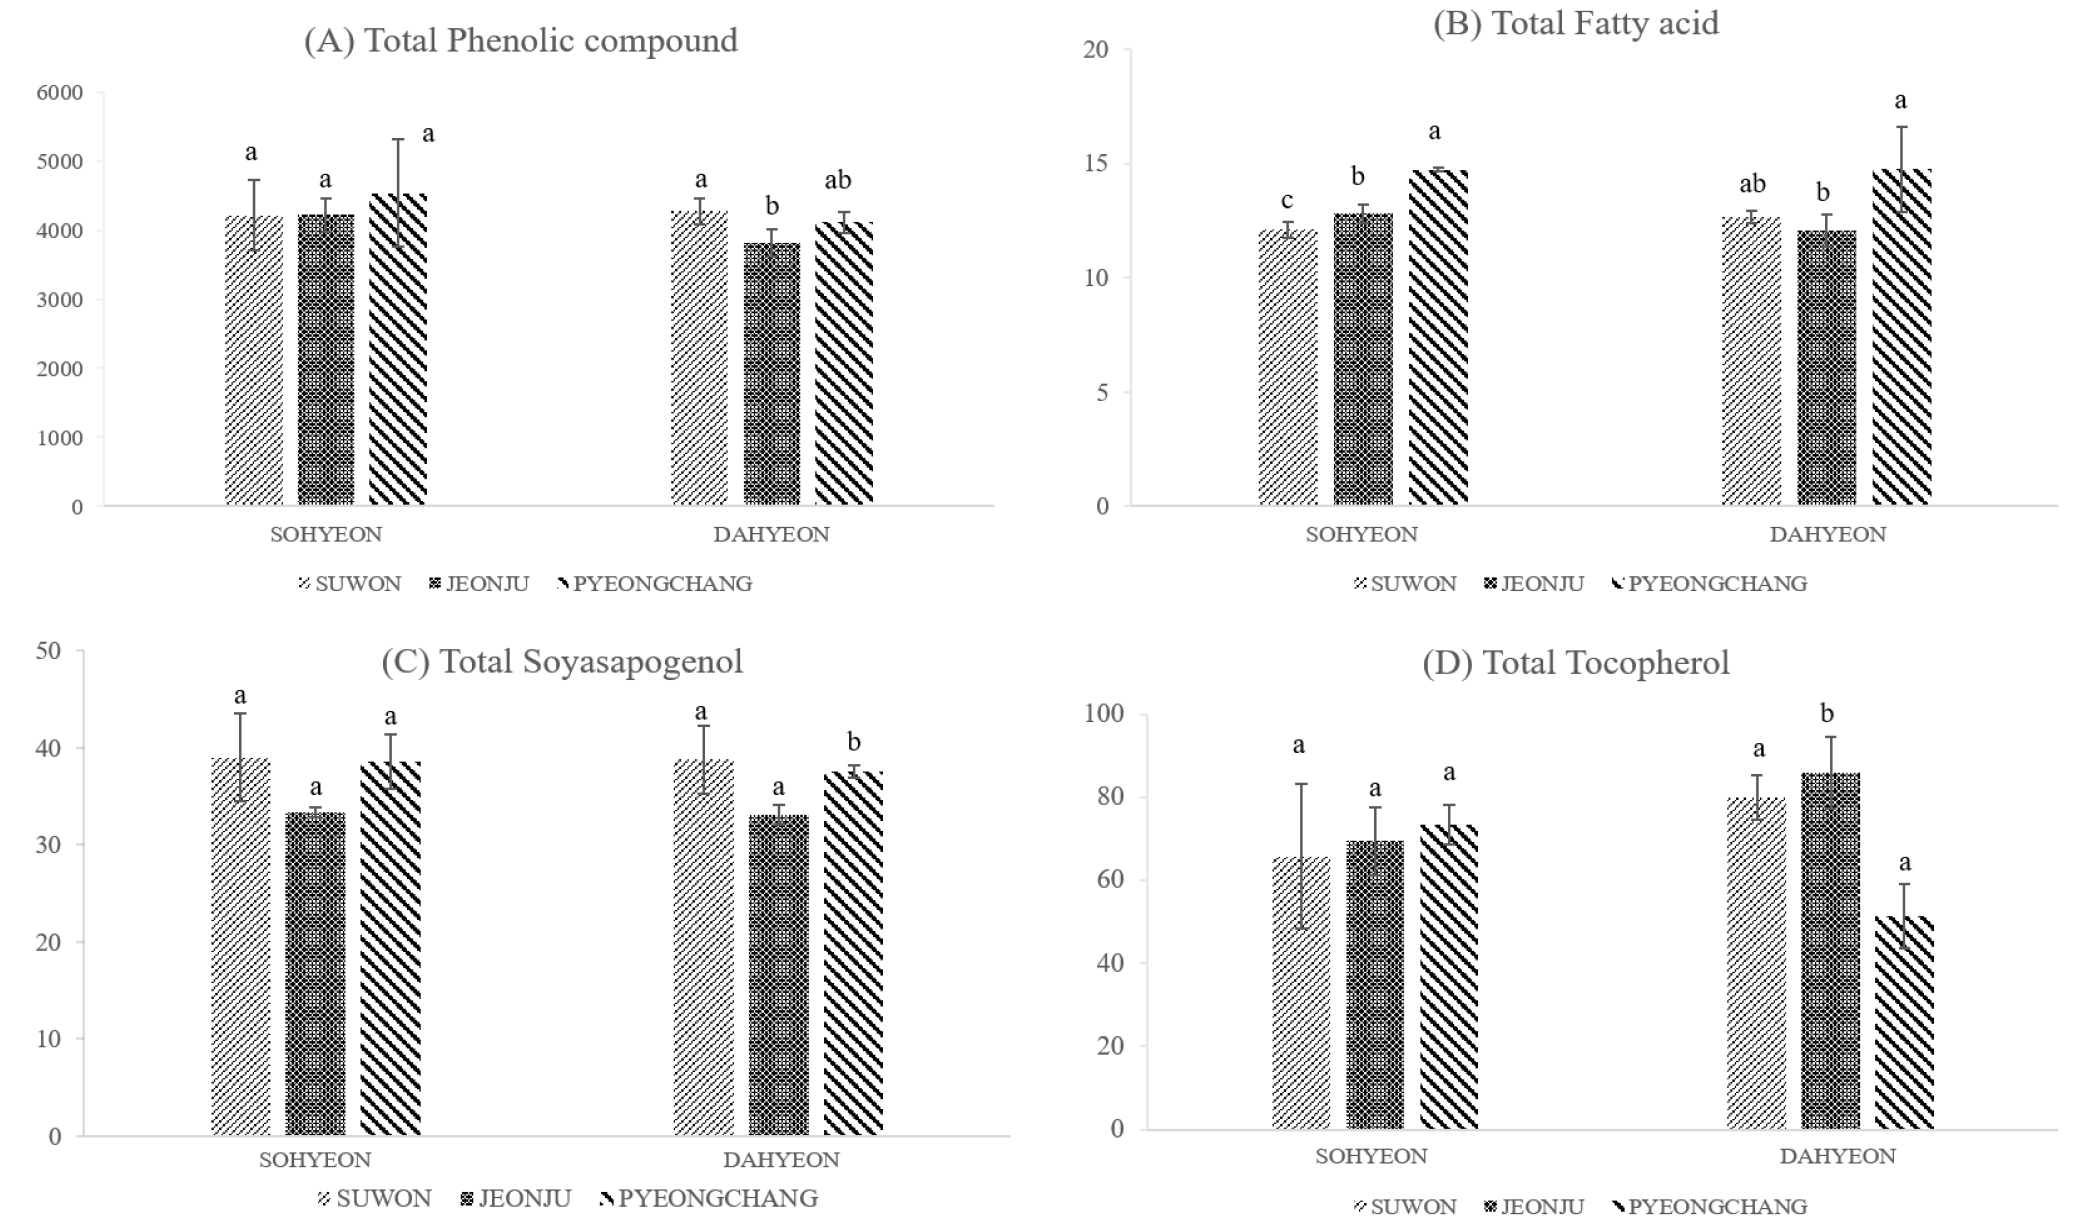
Table 2 shows the difference in fatty acid content of Sohyeon and Dahyeon cultivars by Suwon, Jeonju and Pyeongchang cultivation regions. Total fatty acids of Dahyeon were the highest at 14.74 ± 1.86 mg․g-1 in Pyeongchang. Sohyeon was also higher in Pyeongchang than in Suwon and Jeonju. The difference in total fatty acids content according to cultivation region showed statistically significant results and could be classified by region (p < 0.05) (Fig. 2). Also, in previous studies, the fatty acid content of mung bean seeds was significantly different according to the cultivation region (Anwar et al., 2007), which is consistent with the results of this study. In Sohyeon, UFA, n-6 PUFA and n-3 PUFA of Pyeongchang were significantly higher than others. The major fatty acids of mung bean were linoleic acid, which accounted for about 40% of the total fatty acids, followed by palmitic acid and α-linolenic acid by about 28% and 15%. This is consistent with previous studies that linoleic acid and palmitic acid content were the highest in mung bean (Anwar et al., 2007). Soyasapogenol, the aglycone of soyasaponin, soyasapogenol A and B, depending on their structures (Zhang & Popovich, 2009). In this study, soyasapogenol A was not found in all varieties of mung bean. Soyaspogenol B content was the higest in Suwon and the lowest in Jeonju in all varieties. However, there was no statistically significant difference in soyasapogenol B. When comparing the difference in the content of total tocopherol according to the cultivation region of mung bean, Dahyeon was the lowest in Pyeongchang at 51.43 ± 7.65 µg/g and Sohyeon was the highest in Pyeongchang at 73.44 ± 4.66 µg/g. In addition, the content of tocopherol was significantly different between regions in all varieties.
Table 2.
Composition of fatty acids in mung bean according to cultivation regions (mg/g dry weight).
∑ SFA; sum of saturated fatty acids, ∑ UFA; sum of unsaturated fatty acids, ∑ MUFA; sum of monosaturated fatty acids, ∑ PUFA; sum of polyunsaturated fatty acids, ∑ long; sum of long chain fatty acids including 13-21 carbons, ∑ very long; sum of long chain fatty acids including more than 22 carbons, ∑ n-3 PUFA; sum of omega-3 fatty acids ∑ n-6 PUFA; sum of omega-6 fatty acids, ∑ n-3/∑ n-6; sum of omega-3 fatty acids/sum of omega-6 fatty acids
Composition and content of mung bean according to seeding dates
In the comparison of seeding dates samples, 13 kinds of phenolic compounds (gallic acid, gentisic acid, p-coumaric acid, protocatechuic acid, p-hydroxybenzoic acid, salicylic acid, caffeic acid, rutin, luteolin, orientin, apigenin, vitexin, isovitexin) were detected. The composition of the phenolic compounds according to seeding dates samples are shown in Table 3. Of these, apigenin, which was not detected in cultivated region comparative samples, was detected in June of Sohyeon and Jangan samples. When compare to the seeding dates, total phenolic compounds contents were higher in July than June in both Sohyeon and Dahyeon. But Jangan was higher in June than July (Fig. 3). The total phenolic compounds in Sohyeon, Dahyeon and Jangan were not show significant difference according to seeding dates. Phenolics are compounds that possess one or more aromatic rings with at least one hydroxyl group (Kim et al., 2013). Furthermore, Phenolic compounds are also considered to be the most important antioxidants in foods (Mariod et al., 2010). Recent interest in these substances has been stimulated by the potential health benefits of the antioxidant activity (McCue & Shetty, 2004). Table 4 shows the difference in fatty acid content of Sohyeon, Dahyeon and Jangan according to the seeding date. The contents of total fatty acids were the lowest in Jangan. When seeding date of Jangan was July, the content was lower than that in June. Sohyeon and Dahyeon showed higher contents in July than June. Sohyeon was statistically significant difference in the total fatty acid according to the seeding date (p < 0.05) (Fig. 3). Previous studies have shown that the crude protein content of mung bean decreased as the seeding time was delayed (Woo et al., 2018). But, The fatty acids content of mung bean tended to increase with delay of seeding date (p < 0.05). The content of soyasapogenol B in Sohyeon, Dahyeon, and Jangan was 49.04 ± 3.68 µg/g, 45.14 ± 2.46 µg/g and 43.74 ± 2.17 µg/g in June, respectively. The contents of all three cultivars were higher in July than in June (Fig. 3). However, there was no statistically significant difference in the soyasapogenol B content of the mung bean according to the seeding date. Previous studies have shown that external conditions such as regional climate, seasonal changes, light and temperature affect the qualitative composition of saponins (Szakiel et al., 2011). At biosynthesis pathway of soyasapogenol, soyasapogenol A is synthesized from soyasapogenol B during seed germination (Takada et al., 2013). In this study, only ungerminated legume seeds were used, so soyasapogenol was not yet synthesized. Therefore, it is necessary to investigate the soyasapogenol composition according to the degree of germination in the subsequent studies. It can be useful for the food industry. Fig. 3 shows the comparison of the total tocopherol contents of Sohyeon, Dahyeon and Jangan varieties by seeding dates. The contents of total tocopherols in June and July of Sohyeon were 44.67 ± 16.78 µg/g and 24.64 ± 1.78 µg/g, respectively. The total tocopherol contents of Sohyeon were higher than that of July when the seeding date was June. Dahyeon was 40.81 ± 7.51 µg/g and 42.73 ± 3.58 µg/g in June and July, respectively and Jangan was 30.91 ± 2.15 µg/g in June and 31.13 ± 4.96 µg/g in July. Both cultivars were higher in July than June. However, the difference in the total tocopherol content of the mung bean during the seeding date is not statistically significant. The α-tocopherol and β-tocopherol were not detected in the mung bean of three varieties, Sohyeon, Dahyeon and Jangan. The δ-tocopherol of mung bean accounts for approximately 4% of total tocopherols and γ-tocopherol accounts for approximately 96% of total tocopherols. Previous studies have shown that most of the tocopherols in mung beans are γ-tocopherol (Anwar et al., 2007). And it is same with this study. Previous studies (Anwar et al., 2007) and this study suggested that the mung bean seeds are an abundant source of tocopherol that is very important. As with many other traits, there are few studies on the tocopherol content of previously reported mung bean seeds.
Table 3.
Composition of phenolic compounds in mung beans sown at different dates (μg/g dry weight).
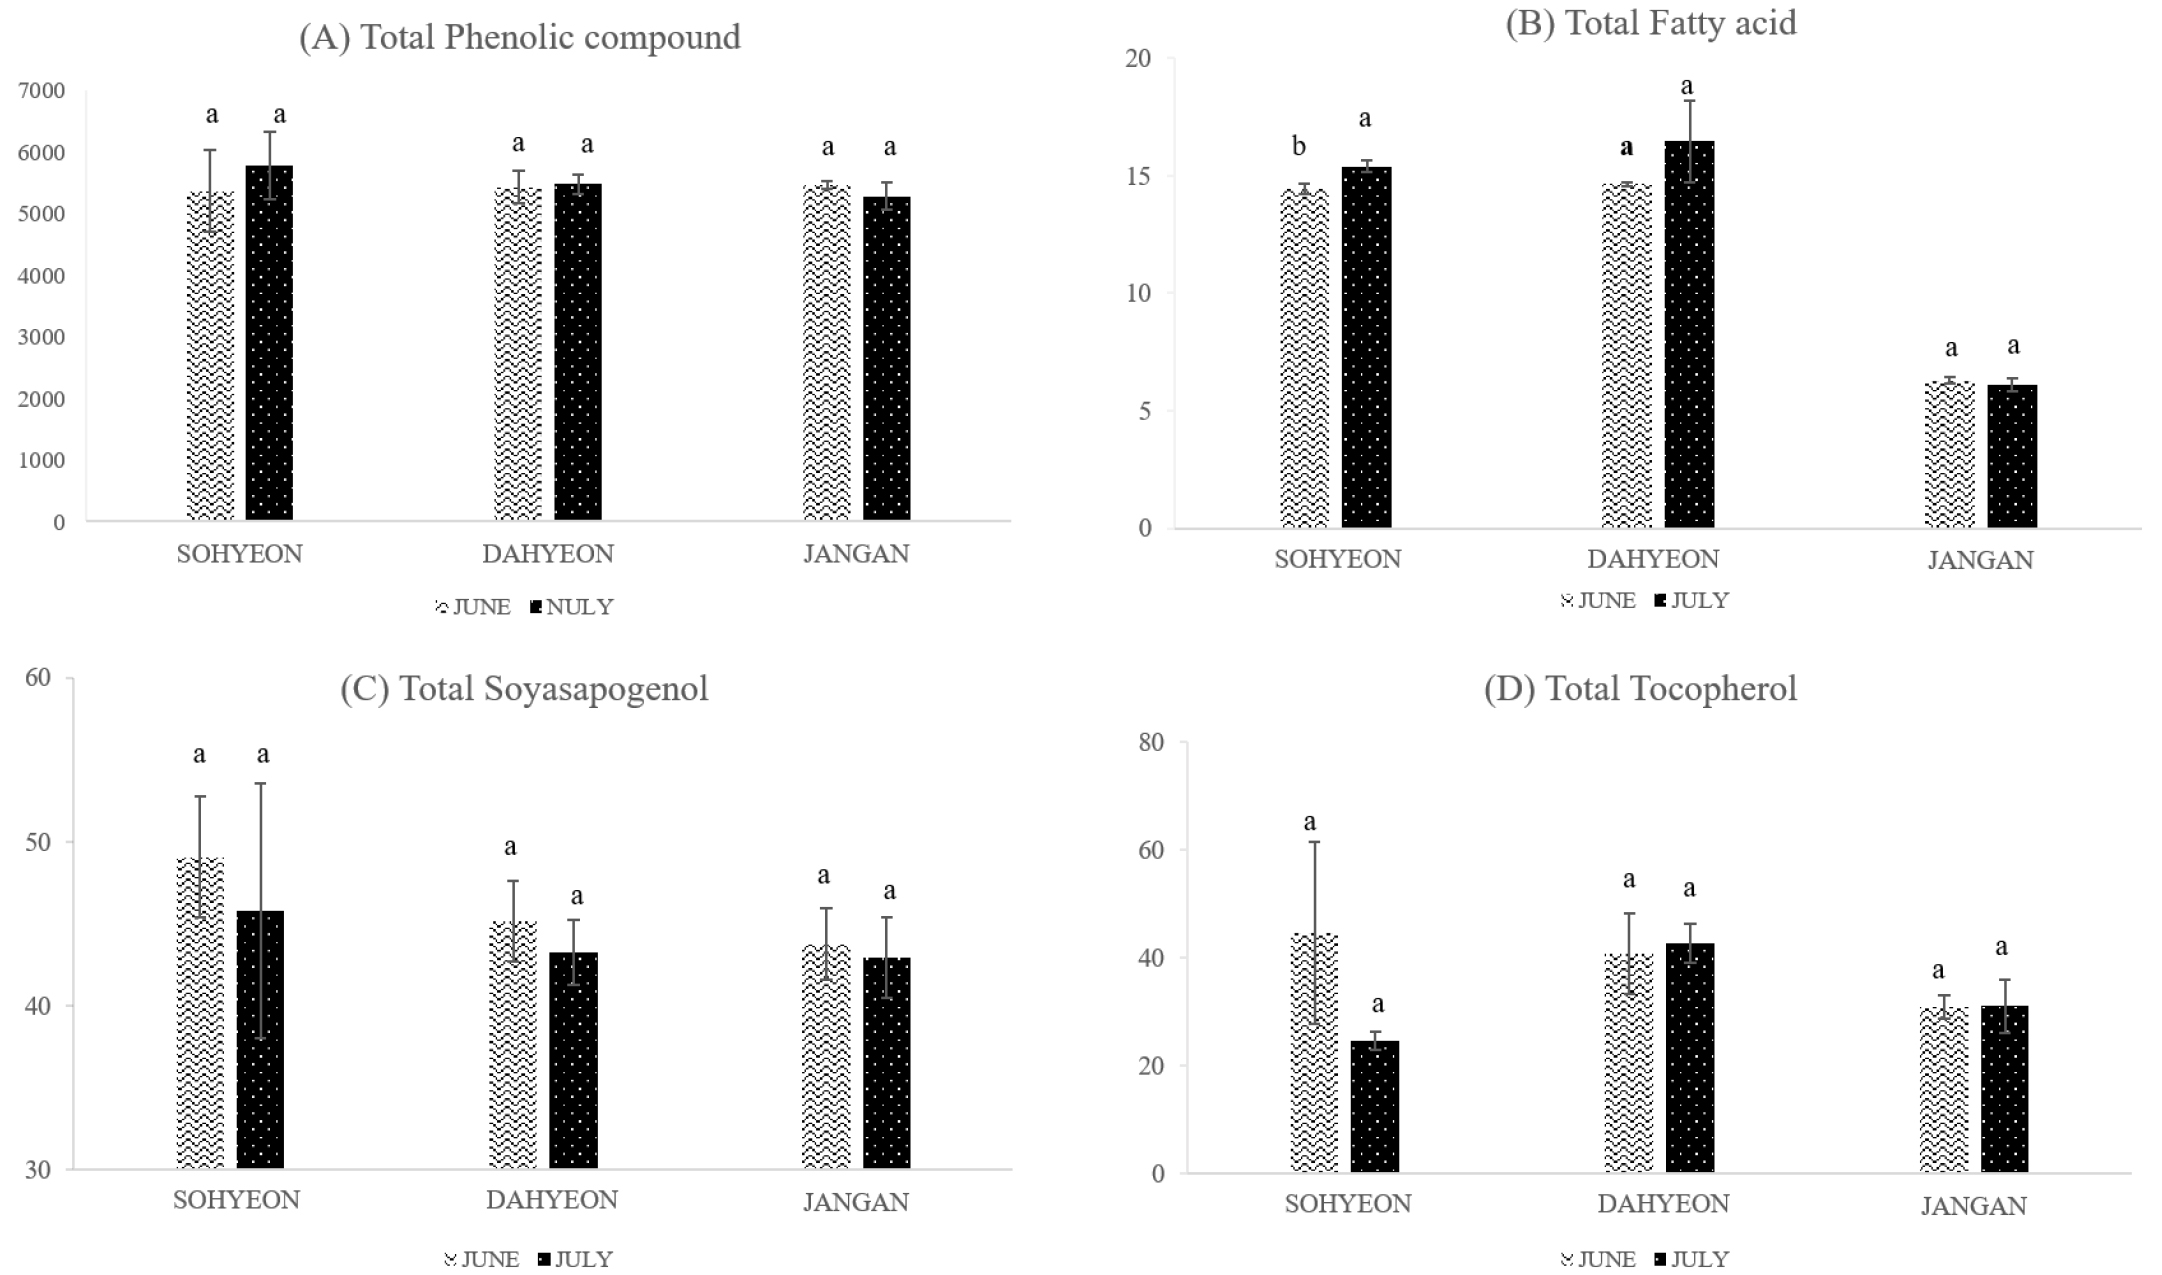
Table 4.
Composition of fatty acids in mung beans according to seeding dates (mg/g dry weight).
a-cValues with different superscripts differ significantly according to mung bean seeding date or variety (p < 0.05).
∑ SFA; sum of saturated fatty acids, ∑ UFA; sum of unsaturated fatty acids, ∑ MUFA; sum of monosaturated fatty acids, ∑ PUFA; sum of polyunsaturated fatty acids, ∑ long; sum of long chain fatty acids including 13-21 carbons, ∑ very long; sum of long chain fatty acids comprising more than 22 carbon atoms, ∑ n-3 PUFA; sum of omega-3 fatty acids ∑ n-6 PUFA; sum of omega-6 fatty acids, ∑ n-3/∑ n-6; sum of omega-3 fatty acids/sum of omega-6 fatty acids
CONCLUSION
As a result, the total phenolic compound of mung beans had regional differences in the varieties of Dahyeon, and the total fatty acids showed significant differences in all varieties according to cultivation regions. The total fatty acid content of Sohyeon only showed a difference in seeding dates. This study found that the difference between the cultivars, which are genetic factors, is greater than the environmental factors of the cultivation regions and the seeding dates. However, further research is expected to be required using more samples, including various cultivation regions, specific climate and temperature control.
