

INTRODUCTION
MATERIALS AND METHOD
Plant materials collection and classification
Field cultivation and data recording
Data analysis
RESULTS AND DISCUSSION
Variations of qualitative agronomic characteristics
Variations of quantitative agronomic characteristics
PCA, HCA, and correlation analyses
INTRODUCTION
Wheat is one of the most widely grown and traded crops in the world, providing a significant source of income for millions of farmers and a foundation for the economies of many nations. It is cultivated on approximately 220 million hectares of land worldwide, with an annual yield of more than 750 million metric tons. Currently, China, India, Russia, the United States, France, and Canada are the top wheat producers in that order (Bordes et al., 2008; Sanchez-Bragado et al., 2023; FAO, 2021). Because wheat contains high levels of carbohydrates, fibers, nutrients, and polyphenols, it is a staple dietary crop in both developed and developing countries. This makes it an important part of a well-balanced diet that benefits human health (Gupta et al., 2021; Royo et al., 2022; Yang et al., 2022). Furthermore, wheat accounts for a substantial amount of the world’s daily caloric intake, making it critical for food security and nutrition (Khan et al., 2023). It also has many industrial applications, including in the food and beverage sectors, where it is used as a crucial raw material to produce a variety of products such as bread, pasta, pastries, and beer, thus reinforcing its economic relevance (Faltermaier et al., 2014; Gupta et al., 2021).
Common wheat (Triticum aestivum subsp. aestivum (L.)) and durum wheat (T. turgidum subsp. durum (Desf.)) are two prominent wheat species widely cultivated in different parts of the world. Both species have a similar genetic origin. However, common wheat is a hexaploid species, while durum wheat is a tetraploid species (Yang et al., 2022; Pignone et al., 2015). The other major differences between common wheat and durum wheat rely on their end-use and gluten properties. Common wheat is mostly used to make bread and baked food products owing to its high gluten concentration which gives bread its distinctive flexibility and rise. Durum wheat, also known as hard wheat, on the other hand, is ideal for making pasta due to its high protein content and gluten quality, which provides the desired texture and hardness (Yang et al., 2022). Despite differences in gluten characteristics and end-use, both common and durum wheat are important species in the human diet and help to ensure global food security. Therefore, they are a research focus, mainly in developing improved wheat varieties (Pignone et al., 2015; Yang et al., 2022).
Developments in molecular biology, genomics, and breeding techniques have significantly advanced wheat breeding in recent years. Modern breeding operations are geared toward developing wheat varieties that are not only high-yielding but also resistant to biotic and abiotic pressures such as pests, diseases, and climate change-related problems (Dodig et al., 2012; Choi et al., 2018; Yang et al., 2022; Lee et al., 2021a). Furthermore, the development of wheat cultivars with improved nutritional profiles has gained prominence (Sun et al., 2023). Overall, wheat breeding is evolving to suit the increasing demands of a worldwide population, to ensure food security, environmental sustainability, and improved wheat product quality. Genetic resources from both common wheat and durum wheat are essential for advancing wheat breeding initiatives. These resources contain a diverse pool of genetic characteristics and attributes that can be exploited to develop enhanced wheat varieties (Ormoli et al., 2015; Royo et al., 2010; Yang et al., 2022). Therefore, documentation and characterization of agro- morphological features of wheat genetic resources are critical for classifying and distinguishing distinct wheat varieties, as well as deciding on suitable crossings to achieve certain breeding goals. By utilizing the genetic diversity of both common and durum wheats, breeders can develop new varieties with desired features such as higher yields, increased disease resistance, and superior end-use attributes, among others (Cao et al., 2015; Dagnaw et al., 2022; Khan et al., 2023). Moreover, such investigations provide essential information to breeders, allowing them to make informed selections and decisions during the breeding process (Tajibayev et al., 2023; Jung et al., 2021; Kumar et al., 2020; Rahimi et al., 2019). These all help to ensure the long-term viability, productivity, and resilience of wheat production around the world (Larkin et al., 2019). Previously, several studies have evaluated the genetic diversity of common and durum wheat varieties grown in Korea and elsewhere (Ambati et al., 2020; Dodig et al., 2012; Cao et al., 2015; Jung et al., 2021; Ormoli et al., 2015; Son et al., 2015; Tajibayev et al., 2023). In most of these studies, however, either common wheat or durum wheat genotypes were exclusively considered. Furthermore, studies investigating the relative characteristics of common and durum wheat genotypes grown under similar environmental conditions are very limited. This study aimed to characterize common wheat (n = 47) and durum wheat (n = 168) germplasms collected from 54 different countries and recently cultivated in Korea using a total of twelve agro-morphological traits. Geumgang, a popular Korean common wheat variety, was used as a control (check) to evaluate the performance of each wheat accession. The results of this preliminary study may provide useful information on the differences in agro-morphological traits between common and durum wheat genotypes and may initiate further research in the future.
MATERIALS AND METHOD
Plant materials collection and classification
The wheat collection used in this study consists of 168 durum wheat and 47 common wheat genotypes obtained from the National Agrobiodiversity Center, Rural Development Administration (RDA, Jeonju, Korea). The germplasms were initially collected from 54 different countries including Afghanistan (AFG), Angola (AGO), Argentina (ARG), Australia (AUS), Azerbaijan (AZE), Bolivia (BOL), Bosnia and Herzegovina (BIH), Brazil (BRA), Bulgaria (BGR), Canada (CAN), Chile (CHL), China (CHN), Croatia (HRV), Cyprus (CYP), Czechoslovakia (CSK), Ecuador (ECU), Egypt (EGY), Eritrea (ERI), Ethiopia (ETH), France (FRA), Georgia (GEO), Germany (DEU), Greece (GRC), Hungary (HUN), India (IND), Iraq (IRQ), Israel (ISR), Italy (ITA), Japan (JPN), Jordan (JOR), Kazakhstan (KAZ), Kyrgyzstan (KGZ), Lebanon (LBN), Macedonia (MKD), Malta (MLT), Mexico (MEX), Morocco (MAR), Nepal (NPL), Pakistan (PAK), Peru (PER), Poland (POL), Portugal (PRT), Russia (RUS), Saudi Arabia (SAU), Serbia (SRB), Spain (ESP), Sweden (SWE), Syria (SYR), Tunisia (TUN), Turkey (TUR), Ukraine (UKR), United States of America (USA), United Kingdom (GBR), and Uzbekistan (UZB). Among the total population, the origin of twenty-three genotypes, including 13 common and 10 durum wheat genotypes, was not confirmed. Geumgang, a common wheat cultivar cultivated in over 70% of wheat area in Korea (Jung et al., 2022), was used as a check. Table S1 (Supplementary material) presents the general information and frequency of the wheat germplasms related to their type, variety, and origin.
Field cultivation and data recording
Cultivation of all the wheat genotypes was conducted during the 2022-2023 winter season in an experimental farm located at the National Agrobiodiversity Center, Jeonju, Republic of Korea (latitude/longitude: 35o49´38.37´´N/127o09´07.78´´E). Twenty-five seeds of each genotype were sown in a row with 5 cm spacing between seeds and 30 cm gap between genotypes on October 21, 2022. The control (check) was similarly cultivated with replication at every 20 genotypes. Fertilizer was applied in recommended doses and methods (RDA, 2020). Specifically, N:P:K at 3.6:7.4:3.9 kg/10ha was applied during sowing. An additional dose of N at 5.5 kg/10ha was applied at tillering stage. The accessions were grown under uniform weather and treatment conditions, and the growth period lasted until June of 2023. The average monthly temperature, humidity, and precipitation in the cultivation are summarized in Fig. 1.

A total of twelve agro-morphological traits were recorded following the manual presented by the Rural Development Administration (RDA, 2006). Among these, five were qualitative characters (spike density, spike color, awn presence (awnedness), awn color, and kernel color), while the remaining seven were quantitative traits (days to heading (DH), days to maturity (DM), days from heading to maturity (DHM), culm (stem) length (CL), awn length (AL), spike length (SL), and one-thousand kernel weight (TKW)). Spike color and awn color were visually measured on a 1-5 scale: 1 (yellowish white), 2 (yellow), 3 (brown), 4 (red to purple), and 5 (black). Kernel color was also visually determined and categorized as white or red. Awnedness (awn presence) was recorded as awnless, awnletted (short awn), and awned (conspicuous awn). Spike density was visually measured on a 1-9 scale: 1 (very loose), 3 (loose), 5 (intermediate), 7 (dense), and 9 (very dense). DH was counted as the number of days from sowing to 40% of plants with the first spikes emerged. DM was determined as the number of days from sowing to the time when the first node became yellow. AL was the length of the longest awn in a spike. CL was measured from the ground to the bottom of the spike at maturity, while SL was measured excluding awns. Similarly, TKW was measured in grams of 1,000 kernels after hand-cleaning and drying.
Data analysis
Data were recorded from the field as well as laboratory inspections. All the quantitative agronomical traits for individual accessions, except for AL, were reported as means from triplicate measurements. Differences between means were statistically evaluated by analysis of variance (ANOVA) followed by Fisher’s least significant difference test at p < 0.05 level (LSD0.05) using xlstat software (Addinsfot, NY, USA). Principal component (PCA), Pearson’s correlation matrix analyses, and boxplots were computed using R-software version 4.0 (www.r-project.org). Hierarchical cluster analysis (HCA) was also generated using JMP-software (SAS, Inc., Cary, North Carolina, USA).
RESULTS AND DISCUSSION
Variations of qualitative agronomic characteristics
Qualitative agronomical traits include categorical characteristics and are among the criteria that provide first-hand information on genetic variability (Sheoran et al., 2019). As highlighted before, differences in genotype, cultivation condition, and years of cultivation affect the morphology and physical appearance of wheat genetic materials (Kumar et al., 2020; Royo et al., 2022, 2010). Therefore, previous studies on different wheat varieties showed ranges of variations in agronomical traits (Ma et al., 2023; Mengistu et al., 2015; Pignone et al., 2015). In this study, five key qualitative agronomical traits including spike density, spike color, awn presence, awn color, and kernel color were recorded for each of the wheat accessions. The characteristic features of individual accessions are provided in Table S2 (Supplementary material). Table 1 summarizes the frequency and relative frequency of each trait across durum wheat accessions, common wheat accessions, and the total population. While 90% of durum wheat accessions had a dense spike, the majority of the common wheat accessions had either dense (40%) or loose (38%) spike density. Geumgang, the control wheat variety, also had loose spikes, and only 10% of the total population had a similar spike density (Table 2). Spike density is an important trait in wheat and it is related to yield. Moreover, it has a significant effect on spike length, spikelet number per spike, and kernel length (Liu et al., 2020; You et al., 2021). Overall, the majority of the durum wheat accessions could be considered as high-yield genotypes compared to the common wheats. Regarding spike color, yellowish-white was dominant in both common (60%) and durum (55%) wheat accessions followed by brown color. Concerning awn presence, only 10 common wheat accessions and 2 durum wheat accessions were awnleted, the remaining all, including the control variety, being awned. Awn color was another trait that showed wide variation between common and durum wheats. In durum wheat, black awn color dominated (70%) followed by yellowish white (58%), while yellowish-white (53%) was dominant in common wheat followed by brown color (34%). A recent review by Sanchez-Bragado et al. (2023) revealed how the presence and/or absence of awn in wheat affects spike photosynthesis, yield, and grain weight. Awns also provide protection against predators and aid grain dispersal. Moreover, the presence of awns could influence postharvest handling and processing (Huang et al., 2020; Ntakirutimana & Xie, 2020). Kernel color is another important trait that is controlled by a variety of trait loci and affects the concentrations health-promoting metabolites in wheats (Li et al., 2023; Ma et al., 2019; Matus-Cádiz et al., 2003). In this study, two dominant kernel colors, including white and red, were recorded. Similar to the control, most of the common and durum wheat accessions developed white kernels with relative frequencies of 74 and 79%, respectively. Red kernel accounted for 26% in common wheats and 21% in durum wheat accessions. In general, the observation of different qualitative traits among the wheat accessions could provide a wide spectrum of options for the selection of genotypes with desirable characteristics (Sun et al., 2023). Moreover, such wide variance could be an important input to induce molecular-level analysis in future studies (Ma et al., 2023).
Table 1.
Frequency (f) of qualitative agronomical traits in common and durum wheat germplasms cultivated in Korea.
Table 2.
Statistics of quantitative agronomical characteristics in common and durum wheat germplasms cultivated in Korea.
| Trait | Wheat type | Min. | Max. | Meanv | SDu | CVt |
Geumgang (Control) | Skew. | Kurt. |
| DHw (Days) | Durum | 184.00 | 215.00 | 198.20a | 5.76 | 2.91 | 0.49 | 0.26 | |
| Common | 166.00 | 214.00 | 193.81b | 9.66 | 4.98 | 171 | -0.47 | 0.65 | |
| Total | 166.00 | 215.00 | 197.24 | 7.05 | 3.57 | -0.46 | 2.13 | ||
| DMx (Days) | Durum | 224.00 | 250.00 | 238.10a | 5.61 | 2.36 | -0.17 | -0.40 | |
| Common | 208.00 | 250.00 | 233.72b | 8.80 | 3.76 | 219 | -0.58 | 0.64 | |
| Total | 208.00 | 250.00 | 237.014 | 6.69 | 2.82 | -0.73 | 1.50 | ||
| DHMy (Days) | Durum | 27.00 | 52.00 | 39.90a | 4.04 | 10.12 | -0.12 | 0.03 | |
| Common | 32.00 | 46.00 | 39.91a | 3.05 | 7.65 | 48 | -0.53 | 0.65 | |
| Total | 27.00 | 52.00 | 39.90 | 3.8 | 9.763 | -0.16 | 0.18 | ||
| Culm length (cm) | Durum | 53.67 | 163.00 | 118.92a | 22.38 | 18.82 | -0.62 | 0.10 | |
| Common | 62.17 | 155.33 | 103.43b | 23.35 | 22.57 | 65.00 | 0.16 | -1.18 | |
| Total | 53.67 | 163.00 | 115.53 | 23.48 | 20.33 | -0.44 | -0.48 | ||
| Spike length (cm) | Durum | 5.33 | 13.00 | 8.18b | 1.36 | 16.68 | 0.36 | 0.16 | |
| Common | 5.83 | 18.67 | 9.81a | 2.60 | 26.48 | 10.00 | 1.13 | 1.70 | |
| Total | 5.33 | 18.67 | 8.54 | 1.84 | 21.53 | 1.52 | 4.87 | ||
| Awn length (cm) | Durum | 5.00 | 19.00 | 11.18a | 2.32 | 20.76 | 0.28 | 0.50 | |
| Common | 0.50 | 15.00 | 6.19b | 3.65 | 58.98 | 5.00 | 0.57 | -0.18 | |
| Total | 0.50 | 19.00 | 10.09 | 3.37 | 33.43 | -0.62 | 0.53 | ||
| TKWz (g) | Durum | 20.33 | 78.00 | 44.73a | 8.10 | 18.11 | 0.32 | 1.20 | |
| Common | 25.00 | 56.67 | 38.74b | 6.83 | 17.64 | 46.00 | 0.22 | -0.16 | |
| Total | 20.33 | 78.00 | 43.42 | 8.22 | 18.94 | 0.33 | 0.89 |
Variations of quantitative agronomic characteristics
Quantitative agronomical traits also play a significant role in the characterization of plant genetic materials and the selection of genotypes with desirable properties (Mondal et al., 2016; Sheoran et al., 2019). A total of seven quantitative traits were recorded in this study, and wide variations were observed among the wheat accessions. Table S3 (Supplementary material) depicts the characteristic features of individual accessions, while their distribution patterns across each quantitative trait are illustrated in Fig. 2A. The statistical values for each of the traits are summarized in Table 2. All the traits, except for SL and TKW, were negatively skewed in the total population. On the other hand, kurtosis was between the highest negative value for CL and the highest positive value for SL. These observations signify that not all of the quantitative traits had normal distributions (Gayacharan et al., 2020). The coefficient of variation was the highest for AL (33.43%) followed by SL (21.53%), and the lowest for DM (2.82%) in the total population. DH ranged from 166 days in accession Rufom-7 (a common wheat of unknown origin) to 215 days in ECH605 (a durum wheat from Great Britain). Likewise, DM was in the range of 208 - 250 days. Once again, Rufom-7 was the earliest to mature, while three durum wheat accessions including Timor (from Brazil), 4 (from Nepal), and HN-ROD25137700 (from Portugal), and one common wheat accession, PI277126 (from Great Britain), equally took the longest days to mature. Overall, the observed DH and DM ranges are comparable to many previous studies. In two independent studies conducted in Korea, DH in the ranges of 156-210 and 168-218 days and DM in the ranges of 209-262 and 209-258 days were reported (Jung et al., 2021; Lee et al., 2021b). These ranges are in agreement with those observed in our study. Compared to our study, much narrower ranges of DH (61.8-78.0 days) and DM (134.0-145.2 days) were found in Ethiopian durum wheats (Dagnaw et al., 2022). Other studies also reported wide-ranging DH and DM values for both common and durum wheat varieties (Baboev et al., 2021; Rahimi et al., 2019; Mohammadi et al., 2019; Khan et al., 2023). Such variations could arise due to differences in growing conditions, number of accessions examined, and year of cultivation, among others (Dodig et al., 2012; Ren et al., 2013). Statistical analysis was also conducted to view the variations in DH and DM between the common wheat and durum wheat accessions as well as in comparison to the control variety. The average DH and DM were both shorter in common wheats (193.8 and 233.72 days, respectively) than in durum wheat accessions (198.04 and 237.99 days, respectively) (p < 0.05). DH and DM for the control variety were 171 and 219 days, respectively. Accordingly, three common wheat accessions including Kwangye W372 from Japan, Ruform-7 and Dongbuk Sabigye 2403-10 of unknown origin were found to be early maturing than the control variety having DM of < 219 days. In contrast, no early maturing durum wheat genotype compared to the control was found. The development of early maturing wheat varieties is one of the main goals of breeding programs (Mondal et al., 2016). These germplasms could therefore be important materials in the development of early maturing wheat varieties.
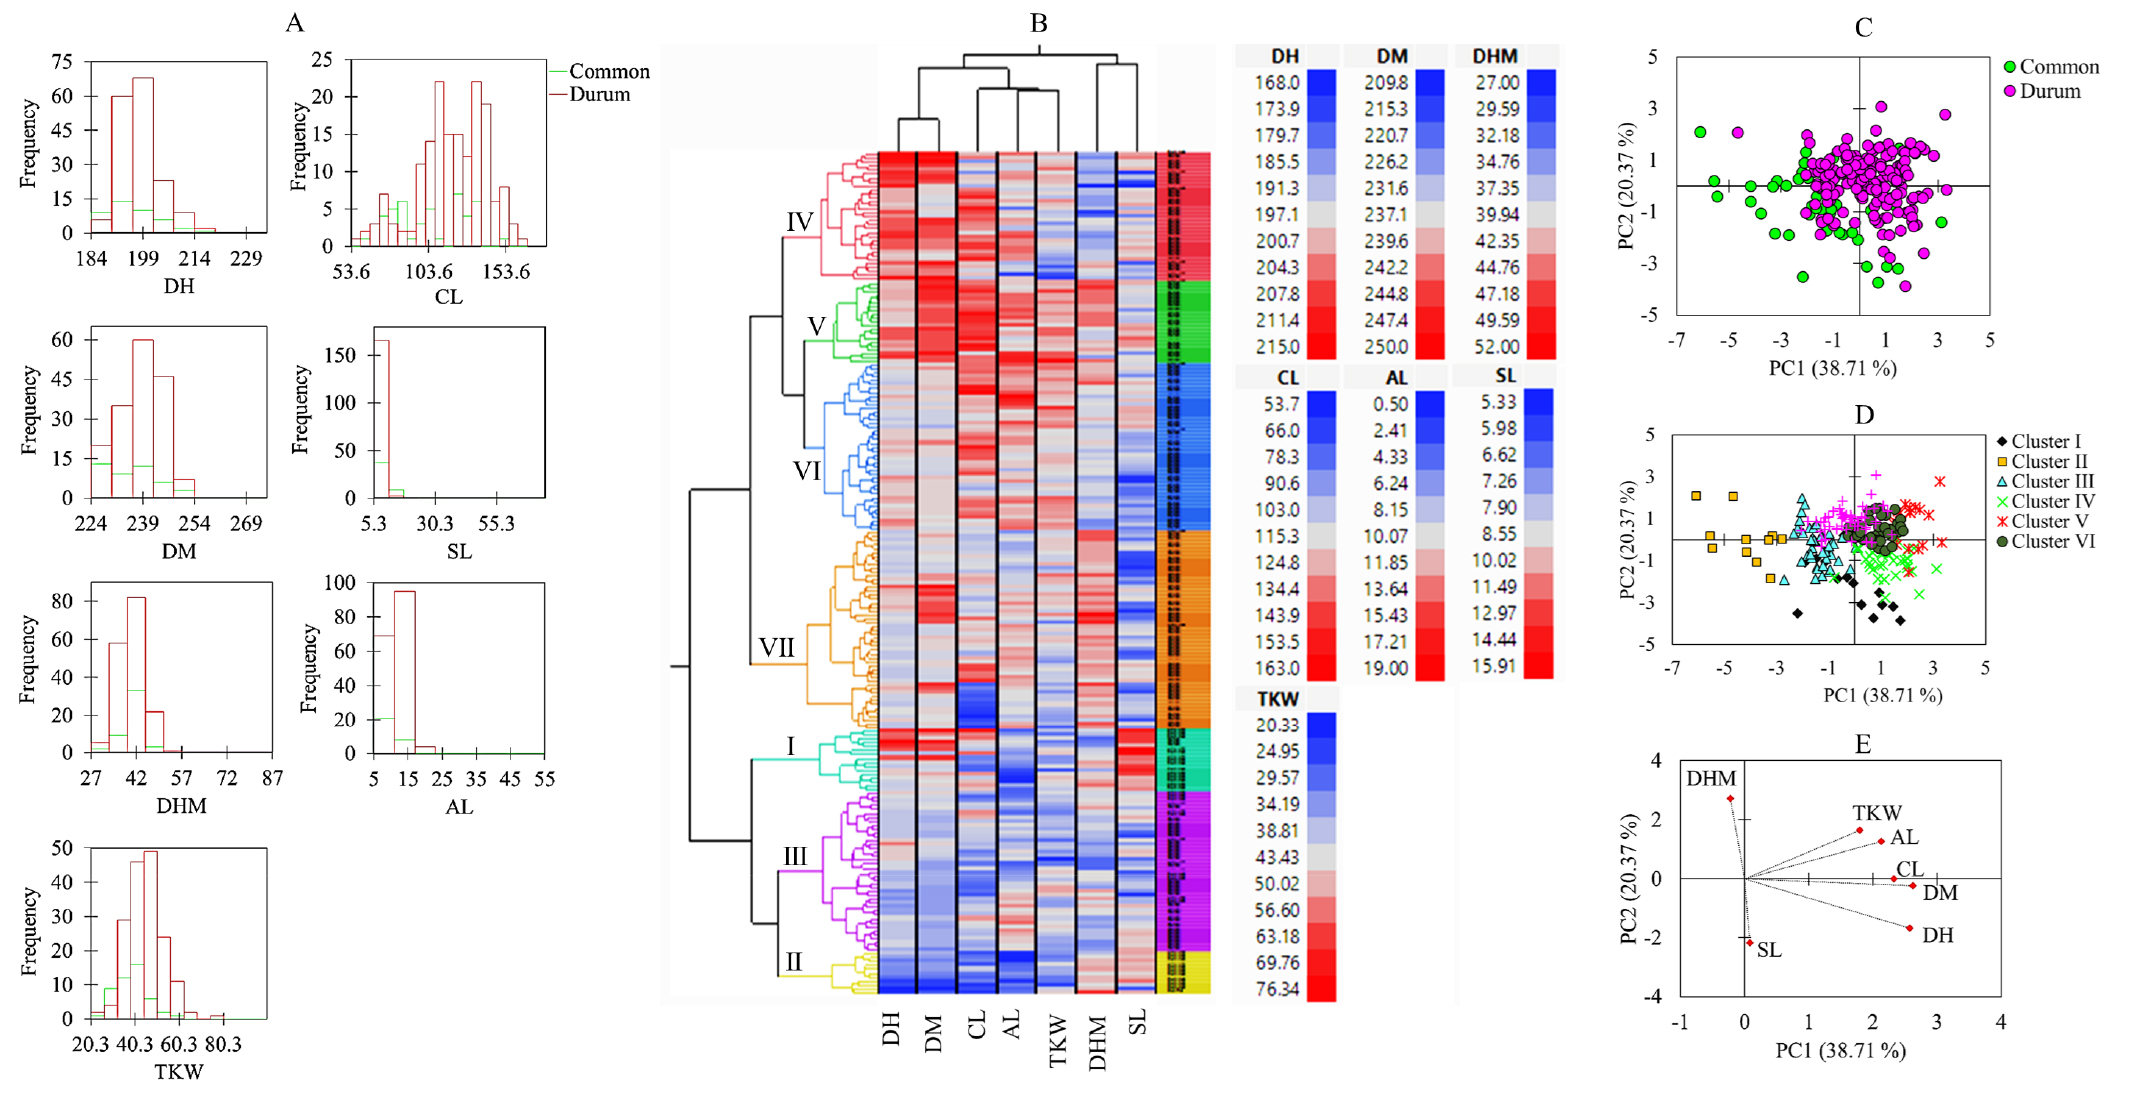
Fig. 2.
Histograms of quantitative agronomical characters (A), hierarchical cluster analysis (B), score plot of accessions based on variety (C) and cluster (D), and loading plot of variables (E) from the principal component analysis. AL: Awn length (cm), CL: Culm length (cm), DH: Days to heading (days), DHM: Days from heading to maturity (days), DM: Days to maturity (days), SL: Spike length (cm), TKW: One-thousand kernel weight (g).
Apart from these growth-related traits, yield-related traits including CL, SL, AL, and TKW were also recorded and showed significant variations. CL ranged from 53.67 cm in accession U13864 (a durum wheat from Italy) to 163.00 cm in Pulawska fwarda (another durum wheat from Poland). Likewise, SL ranged from 5.33 cm in Akserez, a durum wheat from Turkey, to 18.67 cm in PI340745, a common wheat from Italy. On the other hand, two common wheats of unknown origin (Dongbuk Sabigye2403-7 and Dongbuk Sabigye2403-9) equally displayed the shortest AL (0.50 cm), while PI184641, a durum wheat from Portugal, displayed the longest AL (19.00 cm). TKW was the lowest (20.33 g) in Doubbi, a durum wheat from Australia, and the highest (78.00 g) in accession PI210948, another durum wheat from Cyprus. Previously, several studies have evaluated the variations of yield-related traits in different wheat genotypes and comparable results were reported. For instance, CL ranging from 40.00 cm to122.70 cm, SL ranging from 3.30 cm to 14.30 cm, and AL ranging from 0.00 cm to 9.80 cm were reported across 287 wheat lines grown in different environments in Korea (Jung et al., 2021). In other studies, SL ranged from 6.25 cm to 14.33 cm and from 7.4 to 17.8 cm (Kang et al., 2019; Lee et al., 2021b), while CL and AL ranged from 60.6 to 107.4 cm and 0.0 to 19.50 cm, respectively across different wheat verities (Kang et al., 2019; Sheoran et al., 2019). On the other hand, Rahimi et al. (2019) reported TKW ranging from 14.9 to 74.50 g which is comparable to the TKW range observed in our study. In other studies, Jung et al. (2021) and Baboev et al. (2021) independently reported TKW in the ranges of 24.00 – 54.00 and 42.0 – 47.8 g, respectively, both ranges being narrower compared to our findings. Such discrepancies could arise due to differences in the number of genotypes analyzed as well as due to the variations in growing conditions, cultivation years, and post-harvest handling as highlighted before (Dodig et al., 2012; Khan et al., 2023; Ren et al., 2013). The variations in yield-related traits between common wheat and durum wheat accessions were also statistically investigated. On average, durum wheat accessions had longer CL (118.92 cm) as well as AL (11.18 cm) than common wheat germplasms (103.43 and 6.19 cm, respectively), the variation of each being significant (p < 0.05) (Table 2). The average TKW was also higher in durum wheat accessions (44.73 g) than in common wheat accessions (38.74 g). In contrast, common wheat accessions had the longest average SL (9.81 cm) than durum wheat accessions (8.18 cm) and the variation was also significant (p < 0.05). A relative comparison to the control variety was also conducted. In the control, CL, SL, and AL were 65.00, 10.00, and 5.00 cm, respectively, while TKW was 46.00 g. Compared to the control, 36.29% of the wheat accessions had higher TKW, the majority of them being durum wheat accessions. In contrast, 7.91% (n =17) of the accessions had lower AL than the control, all being common wheat varieties. On the other hand, only one common wheat (KwangyeW372 from Japan) and three durum wheat (U13864 from Italy, Sofare from France, and U13923 of Unknown origin) accessions had lower CL than the control. In terms of SL, a total of 32 accessions including 18 common and 14 durum accessions had higher SL than the control. As highlighted before, CL, SL, AL, and TKW are yield-related agronomical traits, and several studies have identified associated genes that control their variations in wheat germplasms (Bordes et al., 2008; Ma et al., 2019; Niu et al., 2020; Tajibayev et al., 2023; Irfan Ullah et al., 2021). Moreover, some of these traits also demonstrate other important properties. For instance, wheat varieties with short CL are thought to be resistant to lodging. Likewise, wheat varieties with long CL of wide diameter are thought to have reduced lodging rates (Matsuyama, 2022; Shah et al., 2019). Overall, those accessions with desirable properties and superior performances could be utilized to maximize yield and reduce lodging (Sun et al., 2023).
PCA, HCA, and correlation analyses
Multivariate statistical tools such as HCA, PCA, and Pearson’s correlation analysis are used to categorize large populations of plant genetic resources and view their association with their characteristic features (De Flaviis et al., 2022; Ormoli et al., 2015). In this study, the HCA and PCA were computed using the whole quantitative data set in the entire population. Accordingly, the HCA clustered the wheat germplasms in two seven groups (Fig. 2B). Cluster I contained 16 accessions, all except two being common wheats. As shown in Fig. 3, this cluster displayed the highest average SL compared to the other clusters (p < 0.05). Cluster II contained ll accessions, all being common wheats. These groups were characterized by having the lowest average DM and DH (p < 0.05). Interestingly, those early maturing accessions and the control variety were all grouped in cluster II. Accessions in cluster II also displayed the lowest average CL, AL, and TKW. In contrast, durum wheat accessions dominated clusters V (n = 21), VI (n = 43), and VII (n = 51), the former containing only one common wheat while the latter two each containing two common wheat accessions. Clusters III and IV each contained 28 durum wheat accessions while having 13 and 5 common wheat accessions, respectively. Contrary to cluster II, cluster V had the highest average CL, AL, and TKW (p < 0.05), while cluster VII had the lowest average spike length (p < 0.05). Overall, the HCA categorized the wheat accessions according to their characteristic features. PCA was also conducted to further view the distribution of the wheat accessions and their relation to the agronomical traits. The PCA yielded three components (PC) with eigenvalues of greater than 1. The first two principal components, PC1 and PC2, displayed 59.09% of the total variance. The score plots along these two components separated the wheat accessions based on their type (Fig. 2C) as well as according to their cluster (Fig. 2D). As shown in the loading plot (Fig. 2E) and Table 3, DH, DM, AL and TKW were the major contributors along PC1 having positive factor loading (FL) above 0.5. No variable had a negative FL above 0.5 along PC1. Along PC2, DHM was the only variable with a positive FL above 0.5, while SL had a negative FL above 0.5 both being the major contributors (Table 3). In general, the PCA supported the HCA observation and signified that quantitative agronomical traits could be used to distinguish between large populations of common wheat and durum wheat genotypes (Sheoran et al., 2019). Correlation analysis was also computed to view the relationship between the quantitative traits (Fig. 4). The variable showed wide-ranging correlations in durum wheat, common wheat, and the whole population with different levels of significance. DH and DM showed a strong correlation regardless of wheat type (r > 0.77, p < 0.001). In agreement with our observation, previous studies also found positive and significant correlation between DH and DM (Jung et al., 2021; Lee et al., 2021b; Sheoran et al., 2019). On the other hand, CL showed positive and stronger associations with SL, AL, and TKW in durum wheats than in common wheats. The correlation between AL and TKW was also positive and strong in durum wheats (r = 0.32), common wheats (r = 0.44), and total population (r = 0.44), each being significant (p < 0.001). In contrast, SL showed a positive correlation with AL in durum wheats (r = 0.15) and a negative correlation in common wheats (r = -0.23), but both correlations were insignificant. Such variable correlations between AL and SL were also noticed in previous studies (Jung et al., 2021; Sheoran et al., 2019). Overall, the observed correlations are in agreement with many previous studies and could provide insight into how growth-related and yield-related traits are correlated in common wheat and durum wheat genotypes (Cao et al., 2015; Jung et al., 2021; Lee et al., 2021b; Son et al., 2015).

Table 3.
Eigenvalues and variability of the first three principal components and contribution of quantitative traits in the PCA.
|
Principal components | Eigenvalue |
Variability (%) |
Cumulative variance (%) | Values | Quantitative traits | ||||||
| DHx | DMw | DHMv | CLu | SLt | ALs | TKWr | |||||
| PC1 | 2.71 | 38.71 | 38.71 | FL | 0.82 | 0.83 | -0.07 | 0.74 | 0.03 | 0.68 | 0.57 |
| % | 24.82 | 25.72 | 0.19 | 20.26 | 0.02 | 16.92 | 12.07 | ||||
| PC2 | 1.43 | 20.37 | 59.09 | FL | -0.45 | -0.06 | 0.74 | 0.00 | -0.59 | 0.35 | 0.45 |
| % | 14.45 | 0.27 | 38.41 | 0.00 | 24.45 | 8.49 | 13.93 | ||||
| PC3 | 1.02 | 14.6 | 73.68 | FLy | -0.21 | 0.03 | 0.44 | 0.28 | 0.74 | -0.29 | 0.26 |
| %z | 4.26 | 0.09 | 19.29 | 7.69 | 53.51 | 8.46 | 6.71 | ||||
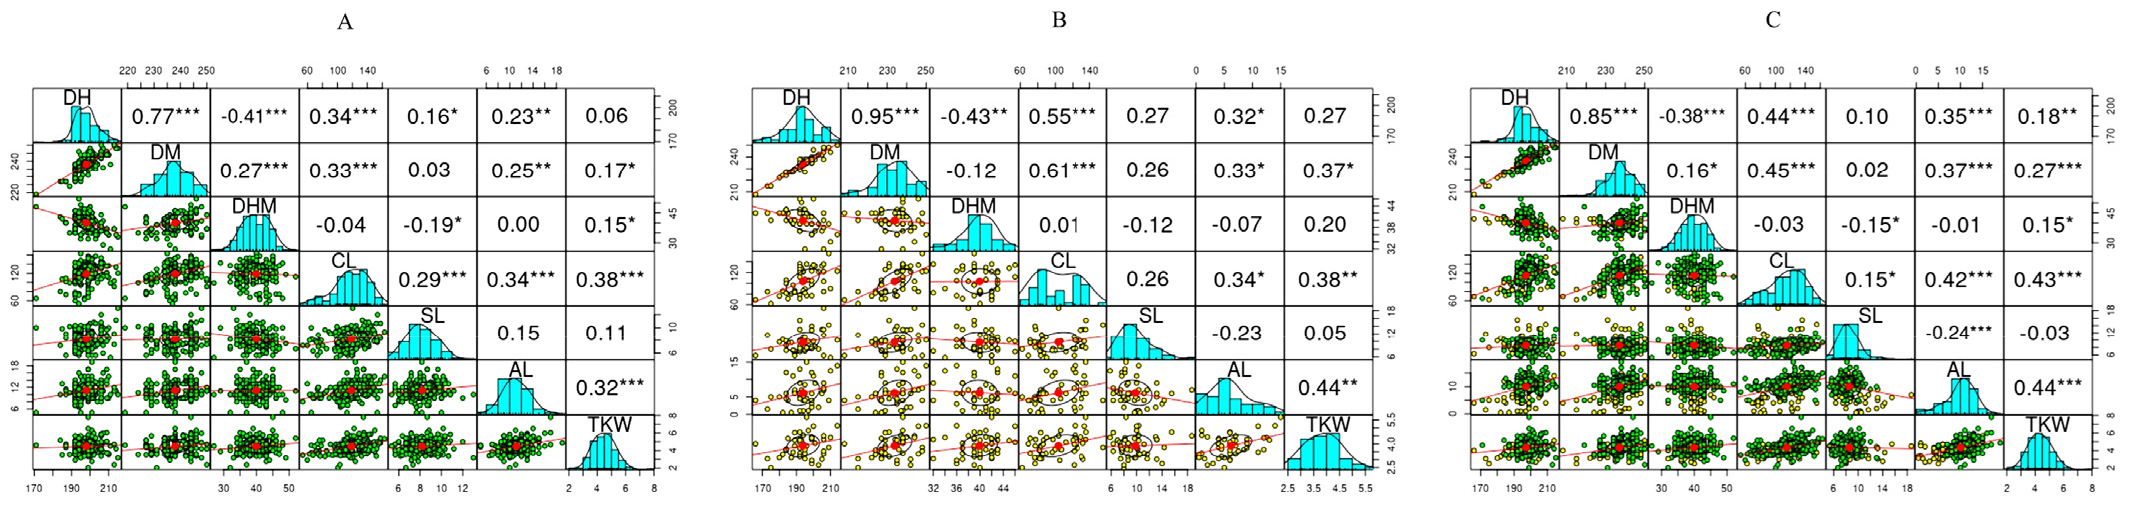
Fig. 4.
Pearson correlation matrix of quantitative variables in durum wheat (A), common wheat (B), and the whole population (C). AL: Awn length, CL: Culm length, DH: Days to heading, DHM: Days from heading to maturity, DM: Days to maturity, SL: Spike length, TKW: One-thousand kernel weight. *p < 0.05, **p < 0.01, ***p < 0.001.
To conclude, this study investigated the diversity of global durum and common wheat accessions recently cultivated in Korea. Wide variations in both qualitative and quantitative agronomical traits were observed among the wheat germplasms. While the common wheat accessions were characterized by early heading and maturity, and longer spike length, durum wheat accessions were characterized by longer culm and awn lengths and a higher one-thousand kernel weight. Moreover, the performance of individual accessions also varied compared to the control variety, and top-performing varieties were identified (Table 4). A total of three early maturing accessions were identified, all being common wheats. Moreover, three durum wheat accessions and one common wheat accession with a lower culm length were also identified. The top 10 accessions with higher culm length, except one, were durum wheats. Similarly, those with higher one-thousand kernels weight and awn length were all durum wheat accessions. In contrast, accessions with lower awn length were all common wheats. Accessions with high spike length are also all common wheats except for two accessions. Among these, three durum wheat accessions including Malta 4, Rosello, and PI210948 simultaneously displayed high one-thousand kernels weight and long awn length. Likewise, common wheat accessions including PI1345219 and ELS6404-151-12 simultaneously displayed shorter awn length and long spike length, while Rufom-7 and Donbuk Sabigye2403-10 simultaneously displayed shorter maturity days and short awn length. Doszegi, a common wheat, and PI345338, a durum wheat, simultaneously displayed long spike length and culm lengths. In general, the accessions with distinct characteristics and superior performances to the control cultivar could be utilized in wheat breeding programs. The variations observed between common wheat and durum wheat accessions could also be a great input for future genomic investigations.
