Original Research Article

The Korean Journal of Crop Science. 31 December 2018. 360-377
https://doi.org/10.7740/kjcs.2018.63.4.360

ABSTRACT


MAIN

  • INTRO

  • MATERIALS AND METHODS

  •   Cultivation of soybean sprouts

  •   Isoflavone analysis

  •   Statistical analysis

  • RESULTS

  •   Isoflavone compositions of soybean sprouts

  •   Classification of isoflavone profiles by multivariate analysis

  •   Correlations among isoflavone profiles by HCA and Pearson’s correlation analysis

  • DISCUSSION

  • CONCLUSIONS

INTRO

In recent years, there has been increasing interest in soybeans (Glycine max (L.) Merrill) and related products, such as soybean sprouts (Kongnamul), soymilk, and tofu, due to their potential health benefits. Soybeans contain various nutrients, including protein, vitamins, minerals, and phenolic compounds. Especially, they are recognized as the richest sources of isoflavones, which are a group of phytoestrogens that have been shown to have beneficial effects on human health, including antioxidant activity, cancer prevention, and bone density improvement. Soybean isoflavones have been reported to reduce the risk of cardiovascular diseases, menopausal symptoms, osteoporosis, and certain types of cancers (Messina et al., 1994; Anthony et al., 1996; Sarkar&Li, 2003; Allred et al., 2005).Several studies have shown that isoflavones have anticarcinogenic effects on hormone-related cancers (Allred et al., 2005; Adlercreutz&Mazur, 1997). The various physiological functions of isoflavones are mediated by mechanisms including estrogenicity, alteration of enzymatic activity in steroid biosynthesis, and activation of immune cell function (Omoni&Aluko, 2005; Barnes, 2010). These discoveries led to the use of soybeans as a source of isoflavones for the production of functional foods (Wang&Murphy, 1994; Setchell&Cole, 2003).

As diphenolic secondary metabolites, isoflavones can be classified into four groups according to their functional groups: glycosides (genistin, daidzin, and glycitin), malonylglycosides (malonylgenistin, malonyldaidzin, and malonylglycitin), acetylglycosides (acetylgenistin, acetyldaidzin, and acetylglycitin), and aglycones (genistein, daidzein, and glycitein) (Setchell&Cole, 2003). Isoflavones are generally synthesized from a branch of the phenylpropanoid pathway, in which phenylalanine is converted to genistein and daidzein by phenylalanine ammonia-lyase, chalcone synthase, and isoflavone synthase. The synthesized compounds can be conjugated sequentially with glucosyl and malonyl sidechains, and sequestered in vacuoles. However, the glycitein biosynthetic pathway is still largely unknown (Barnes, 2010; Yu et al., 2003). Recent studies showed that the seed isoflavone content of soybean cultivars can be affected by their genetic variation, as well as environmental factors (precipitation, temperature, year, and location of cultivation) (Caldwell et al., 2005; Hoeck et al., 2000; Carrao-Panizzi et al., 2009).

The soybean sprout is an important traditional vegetable food in China, Japan, and Korea, as it can be produced relatively easily at a low cost. In Korea, the mass production of soybean sprouts is an important agriculture business, with an annual consumption of more than 500,000 tons (Hwang, 2004). The impacts of the genetic varieties, cultivation condition, and crop management on isoflavone concentrations in soybean sprouts have been examined, in order to improve the quality and quantity of the sprouts. Previous studies reported that soybean sprouts have higher concentrations of isoflavones than the corresponding seeds (Kim et al., 2006; Kim et al., 2004a,b). The total isoflavone concentrations in 30 varieties of soybean sprouts produced in Korea are reported to vary from 768 to 3343 μg/g (Kim et al., 2003). The isoflavone levels in different parts of the sprout (cotyledons, hypocotyles, and roots) are also affected by the germination period (Kim et al., 2004a,b; Phommalth et al., 2008) and light condition during cultivation (Kim et al., 2006; Lee et al., 2007). Several studies have focused on the diversity of isoflavone compounds among soybean sprouts of different genotypes. However, to the best of our knowledge, a comparative study of the isoflavone composition in soybean sprouts with different countries of origin has not been reported.

In this study, we investigated the isoflavone contents in 68 varieties of soybean sprouts from three countries (China, Japan, and Korea), and analyzed their isoflavone profiles using data mining techniques, namely principal components analysis (PCA), partial least squares discriminant analysis (PLS-DA), orthogonal projections to latent structures discriminant analysis (OPLS-DA), Pearson’s correlation analysis, and hierarchical clustering analysis (HCA) to distinguish possible compositional differences based on the country of origin.

MATERIALS AND METHODS

Cultivation of soybean sprouts

Sixty eight soybean germplasms collected from 3 different countries, Japan (12 varieties), China (15 varieties), and Korea (41 varieties), were distributed by the Rural Development Administration (RDA, Suwon, Gyonggi-do, Korea). Soybean seeds were first soaked in distilled water at room temperature for 4 h. Then the soaked soybean were cultivated in the dark in a greenhouse for 5 days, which is a popular standard method in Korea.

Isoflavone analysis

The harvested soybean sprouts were dried in a freeze-dryer (Freezeone 4.5; Labconco, Kansas, Missouri, USA) in vacuum, and then ground into powder. The extraction of isoflavones followed the method of Wang&Murphy (Wang&Murphy, 1994). 2 g of ground sample was mixed with 10 mL of acetonitrile and 2 mL of 0.1 N HCl, then stirred for 2 h at room temperature. The extracts were filtered through Whatman No. 42 filter paper (125 mm × 100 circles, Maidstone, UK) and concentrated using a vacuum evaporator (EYELA; Tokyo Rikakikai, Co. Ltd, Japan) at 40°C. The residues were dispersed in 10 mL of methanol (100%, HPLC grade; J. T. Baker), and filtered through a 0.2-µm nylon membrane syringe filter. Isoflavone analysis was performed using a method modified from that of Lee et al (Lee et al., 2007). Standard isoflavone compounds were purchased from Wako Pure Chemical Industries Ltd. (Osaka, Japan). These standard compounds were dissolved separately in dimethylsulfoxide (DMSO; Sigma- Aldrich, USA) at several concentrations, and a high linearity (r2 > 0.997) was obtained for each case. An HPLC system (Younglin YL 9100), with a UV/VIS detector (YL 9120) equipped with a YMC ODS AM-303 column (5 μm, 250 × 4.6 mm I.D.) and an autosampler (YL 9150) was used. Solvent A was 0.1% glacial acetic acid in distilled water, and solvent B was 0.1% glacial acetic acid in acetonitrile (ACN). The mobile gradient used in this study was as follows: 0 min, 85% A:15% B; 0–50 min, 65% A:35% B; and 50–60 min, 65% A:35% B. The run time was 60 min, and the flow rate was 1 mL·min-1. The injection volume was 20 µL and the wavelength of the UV detector was 254 nm. Also, 4 groups isoflavones in soybean sprouts are shown in the Supporting Information (Appendix 1, 2, 3, 4).

Statistical analysis

All experimental design of each soybean samples consisted of a completely randomized design with two replicates. All analyses were performed at least twice, and unit variance scaling was applied to all data prior to the analyses. PCA, PLS-DA, and OPLS-DA were performed using SIMCA-P version 13.0 (Umetrics, Umeå, Sweden) to evaluate differences among the multivariate data. The PCA and PLS-DA output consisted of score plots to visualize the contrast among the samples, and loading plots that explain the cluster separation. OPLS-DA was subsequently used to improve the separation. Pearson’s correlation analysis was performed with the SAS 9.2 software package (SAS Institute, Cary, NC, USA). HCA and heat map visualisation of the correlation coefficients were performed using the software Multi-Experiment Viewer version 4.9.0 (http://www.tm4.org/mev/).

RESULTS

Isoflavone compositions of soybean sprouts

Soybean is a useful crop because it contains many compounds that have health benefits such as protein, isoflavones, fiber and other various phytochemicals (Kim et al., 2012). We used HPLC analysis to measure the contents of 12 isoflavones in the soybean sprout samples. Quantitative data for the 68 varieties are shown in Table 1 and Supporting Information. Results observed in the present study regarding differnces in total isoflavone contents between soybean genotypes. The total content of the 12 isoflavones was found to vary widely (325–1553 μg/g dry weight (DW)) among different genotypes. However, no significant differences in the total isoflavone content and its chemical composition were observed among the three countries of origin.

Table 1. Content (µg/g dry weight) of isoflavones in soybean sproutsa.

IT No.OriginGlycosidebMalonyl glycosidecAcetyl glycosidedAglyconeeSum
CS00732 China267.35±5.95753.10±1.2660.80±3.39117.21±0.181198.46±8.24
CS00733China231.88±2.04683.65±5.0939.10±0.1243.57±0.59998.20±2.59
CS00734China228.50±2.55519.65±7.2952.42±2.5668.22±1.52868.80±13.92
CS01248China317.07±3.65659.01±1.8615.81±0.5445.81±0.261037.69±1.50
CS01250China108.14±0.15191.10±0.00135.04±0.76483.79±0.79918.07±0.12
CS01252China347.44±1.06437.49±1.0313.91±0.07104.46±0.83903.30±2.98
CS01277China212.27±7.29300.11±0.4418.93±0.8789.38±0.40620.68±9.01
CS01278China129.86±1.77212.25±1.8813.31±0.1670.16±0.24425.59±3.58
CS01381China133.21±0.83290.75±1.5118.40±0.5560.16±1.57502.52±0.22
CS01383China225.72±0.90486.37±3.2041.21±5.46164.52±1.72917.82±9.48
CS01385China192.79±1.27237.99±0.6856.67±0.08236.29±0.36723.74±0.15
CS01386China157.56±0.42224.66±0.0789.90±0.14214.41±0.07683.53±0.14
CS01567China267.62±2.89681.02±0.3630.73±0.8561.67±0.071041.04±1.61
CS01804China103.70±0.72189.33±2.1053.29±2.22102.69±0.81449.02±4.23
CS02685China175.07±1.50133.79±0.26317.22±0.56347.66±2.10973.74±0.91
CS00736Japan257.42±1.66953.89±4.2635.02±1.9372.33±0.791318.67±4.78
CS00738Japan126.78±0.58380.66±3.4410.63±0.4162.54±0.34580.60±2.11
CS00740Japan240.75±7.65817.62±11.4719.19±1.3660.57±1.741138.13±22.22
CS02052Japan86.04±1.02226.06±1.2215.39±0.4361.46±0.38388.96±1.43
CS02059Japan146.87±1.80182.15±1.299.99±0.2165.59±0.02404.59±3.33
CS02065Japan230.63±2.63598.58±2.4657.29±1.10141.26±0.191027.76±6.39
CS02205Japan343.41±1.10554.51±0.2466.16±1.88382.57±1.471346.65±4.68
CS02564Japan235.82±0.59404.52±1.44121.45±1.48161.81±0.66923.59±1.21
CS02587Japan139.90±0.21166.60±0.528.85±1.3335.26±0.05350.61±1.07
CS02590Japan108.22±0.28270.81±1.2327.17±0.4241.30±1.48447.50±2.01
CS02599Japan166.73±0.13596.37±0.7434.02±0.5666.18±1.56863.31±0.38
CS02665Japan123.49±1.57351.95±1.5113.31±1.73216.75±1.48705.50±3.28
CS01407Korea377.17±9.62802.34±2.4416.92±0.2183.22±0.271279.65±11.57
CS01408Korea294.90±9.56383.39±6.4541.31±0.58214.60±1.66934.19±2.03
CS01416Korea290.55±0.38432.45±4.0824.54±0.7251.56±1.71799.11±1.27
CS01426Korea312.37±0.79421.15±0.8437.64±0.5197.49±2.15868.65±4.30
CS01429Korea160.31±6.64154.09±2.0220.83±0.66111.33±0.68446.56±8.63
CS01924Korea189.82±2.63393.18±1.71238.62±2.89260.35±1.011081.97±4.83
CS01949Korea328.75±0.94741.49±2.7324.05±0.0853.01±0.681147.30±1.03
CS01972Korea184.42±1.20405.65±3.4616.56±0.0767.19±0.54673.81±2.87
CS02554Korea317.32±1.59687.17±0.9119.88±0.8753.74±0.761078.12±4.13
CS02576Korea130.36±2.45296.76±0.1114.74±0.72126.38±1.62568.24±3.45
CS02594Korea236.27±0.11390.86±2.5927.61±0.1239.35±0.90694.08±3.73
CS02602Korea135.08±0.40381.27±2.0620.87±0.0848.84±1.44523.06±3.81
CS02603Korea169.97±0.37597.35±1.0775.34±4.43122.96±0.30965.62±4.03
CS02606Korea127.90±0.40386.68±2.6428.11±1.3575.44±2.42618.13±4.11
CS02615Korea114.97±1.67331.68±1.3623.95±1.3699.13±0.1569.74±1.26
CSRV001Korea186.18±0.43414.07±1.7226.08±0.26116.44±1.72742.77±0.17
CSRV003Korea184.90±1.67382.25±9.1750.40±1.2484.78±1.14702.33±9.89
CSRV015Korea333.17±0.38770.91±4.4322.20±1.2293.46±0.431219.74±2.39
CSRV016Korea170.19±1.12415.93±1.8115.97±3.2343.35±0.13645.44±4.03
CSRV017Korea136.12±0.55318.73±3.6312.70±0.5333.59±0.95501.14±2.65
CSRV018Korea81.58±0.57190.18±1.0817.81±0.4935.76±0.16325.33±0.15
CSRV020Korea383.25±1.35905.25±3.4516.90±0.0789.78±0.591395.18±1.44
CSRV021Korea317.47±4.20601.69±0.4120.76±1.56613.29±1.441553.21±4.73
CSRV022Korea359.12±4.36723.39±3.0429.25±0.62172.49±2.891284.24±10.91
CSRV023Korea288.55±1.86693.60±5.2014.98±1.81233.97±5.221231.10±6.74
CSRV024Korea299.23±4.26701.03±5.1519.44±1.39126.63±34.591146.33±34.09
CSRV027Korea386.39±3.87542.08±5.0929.94±1.04115.38±2.011073.80±12.00
CSRV029Korea162.27±1.87553.01±11.2741.49±1.1075.52±1.24832.29±10.79
CSRV030Korea161.47±1.92563.55±3.7220.11±0.2290.06±0.03835.19±2.05
CSRV031Korea354.08±0.50517.19±7.5822.47±1.30141.35±0.761035.09±6.02
CSRV032Korea218.67±3.84585.95±11.188.76±0.0267.00±0.46880.38±15.47
CSRV033Korea250.19±0.84525.29±1.1117.79±0.5521.79±0.59815.06±0.87
CSRV034Korea225.96±4.00531.79±7.329.94±0.1223.30±2.41791.00±13.85
CSRV035Korea238.40±2.54450.28±4.6416.33±0.2649.51±0.53754.51±2.37
CSRV036Korea142.61±1.00222.02±0.3916.34±1.5842.52±0.40423.49±2.57
CSRV037Korea274.96±2.87411.92±0.1915.35±0.77124.75±0.83826.98±3.13
CSRV038Korea336.82±1.45677.63±1.0347.47±0.8380.38±0.411142.31±0.01
CSRV039Korea96.57±0.32257.24±0.5016.96±0.2545.83±0.19416.60±1.26
CSRV040Korea141.77±1.21225.01±3.1217.15±0.3650.90±1.26434.83±5.95
CSRV041Korea179.69±1.46279.68±1.7925.66±1.2551.48±1.71536.51±2.63
CSRV042Korea152.26±0.16356.50±2.1669.31±9.2125.10±0.25603.17±7.46

aEach value represents the mean ± standard deviation (n = 2). bGlycoside content is the sum of daidzin, glycitin, and genistin contents. cMalonylglycoside content is the sum of malonyldaidzin, malonylglycitin, and malonylgenistin contents. dAcetylglycoside content is the sum of acetyldaidzin, acetylglycitin, and acetylgenistin contents. eAglycone content is the sum of daidzein, glycitein, and genistein contents.

Among 68 soybean sprouts resources, the total isoflavone compounds showed the highest concentrations in CSRV021 as 1553.21 ± 4.73 μg/g. Isoflavones were divided into four gropus that were glycosides, malonylglycosides, acetylglycosides and aglycones. Among the four isoflavone group, the malonyl-conjugated group had the highest content in most varieties, followed by glycosides, aglycones, and acetylglycosides. The malonyl glycoside and glycoside contents showed the highest in CSRV020 (905.25 ± 3.45 μg/g, 383.25 ± 1.35 μg/g). The acetyl glycosides showed higher in CS02685 (317.22 ± 0.56 μg/g), the aglycone group revealed higher in CSRV021 (613.29 ± 1.44 μg/g). While, the glycoside group had the lowest concentrations in CSRV018 (81.58 ± 0.57 μg/g), the malonyl glycoside contents showed the lowest in CS02685 (133.79 ± 0.26 μg/g). And, the acetyl glycosides showed lower in CSRV032 (8.76 ± 0.02 μg/g), the aglycone showed the lowest in CSRV033 (21.79 ± 0.59 μg/g).

Classification of isoflavone profiles by multivariate analysis

To examine the differences in isoflavone profiles among the genetic varieties, PCA and PLS-DA were carried out. These two methods are commonly used as clustering techniques to identify how one group of samples differs from another, which variables contribute the most strongly to the difference, and whether the variables are correlated (Kim et al., 2013; Park et al., 2013). Fig. 1A shows the PCA results by plotting the principal component scores. The two highest- ranking principal components accounted for 51.6% (28.6% for component 1 (PC1) and 23.0% for component 2 (PC2)) of the total variance within the data set. Upon combining these two components, the CSRV021 sample (from Korea) appeared as an outlier. To identify the compounds that contributed most to the separation, the factor loadings in PC1 and PC2 were compared. The corresponding loading in PC1 was positive for all measured compounds except acetylgenistin (Fig. 1B). The variations in PC1 and PC2 were mainly attributed to genistin and daidzein, respectively.
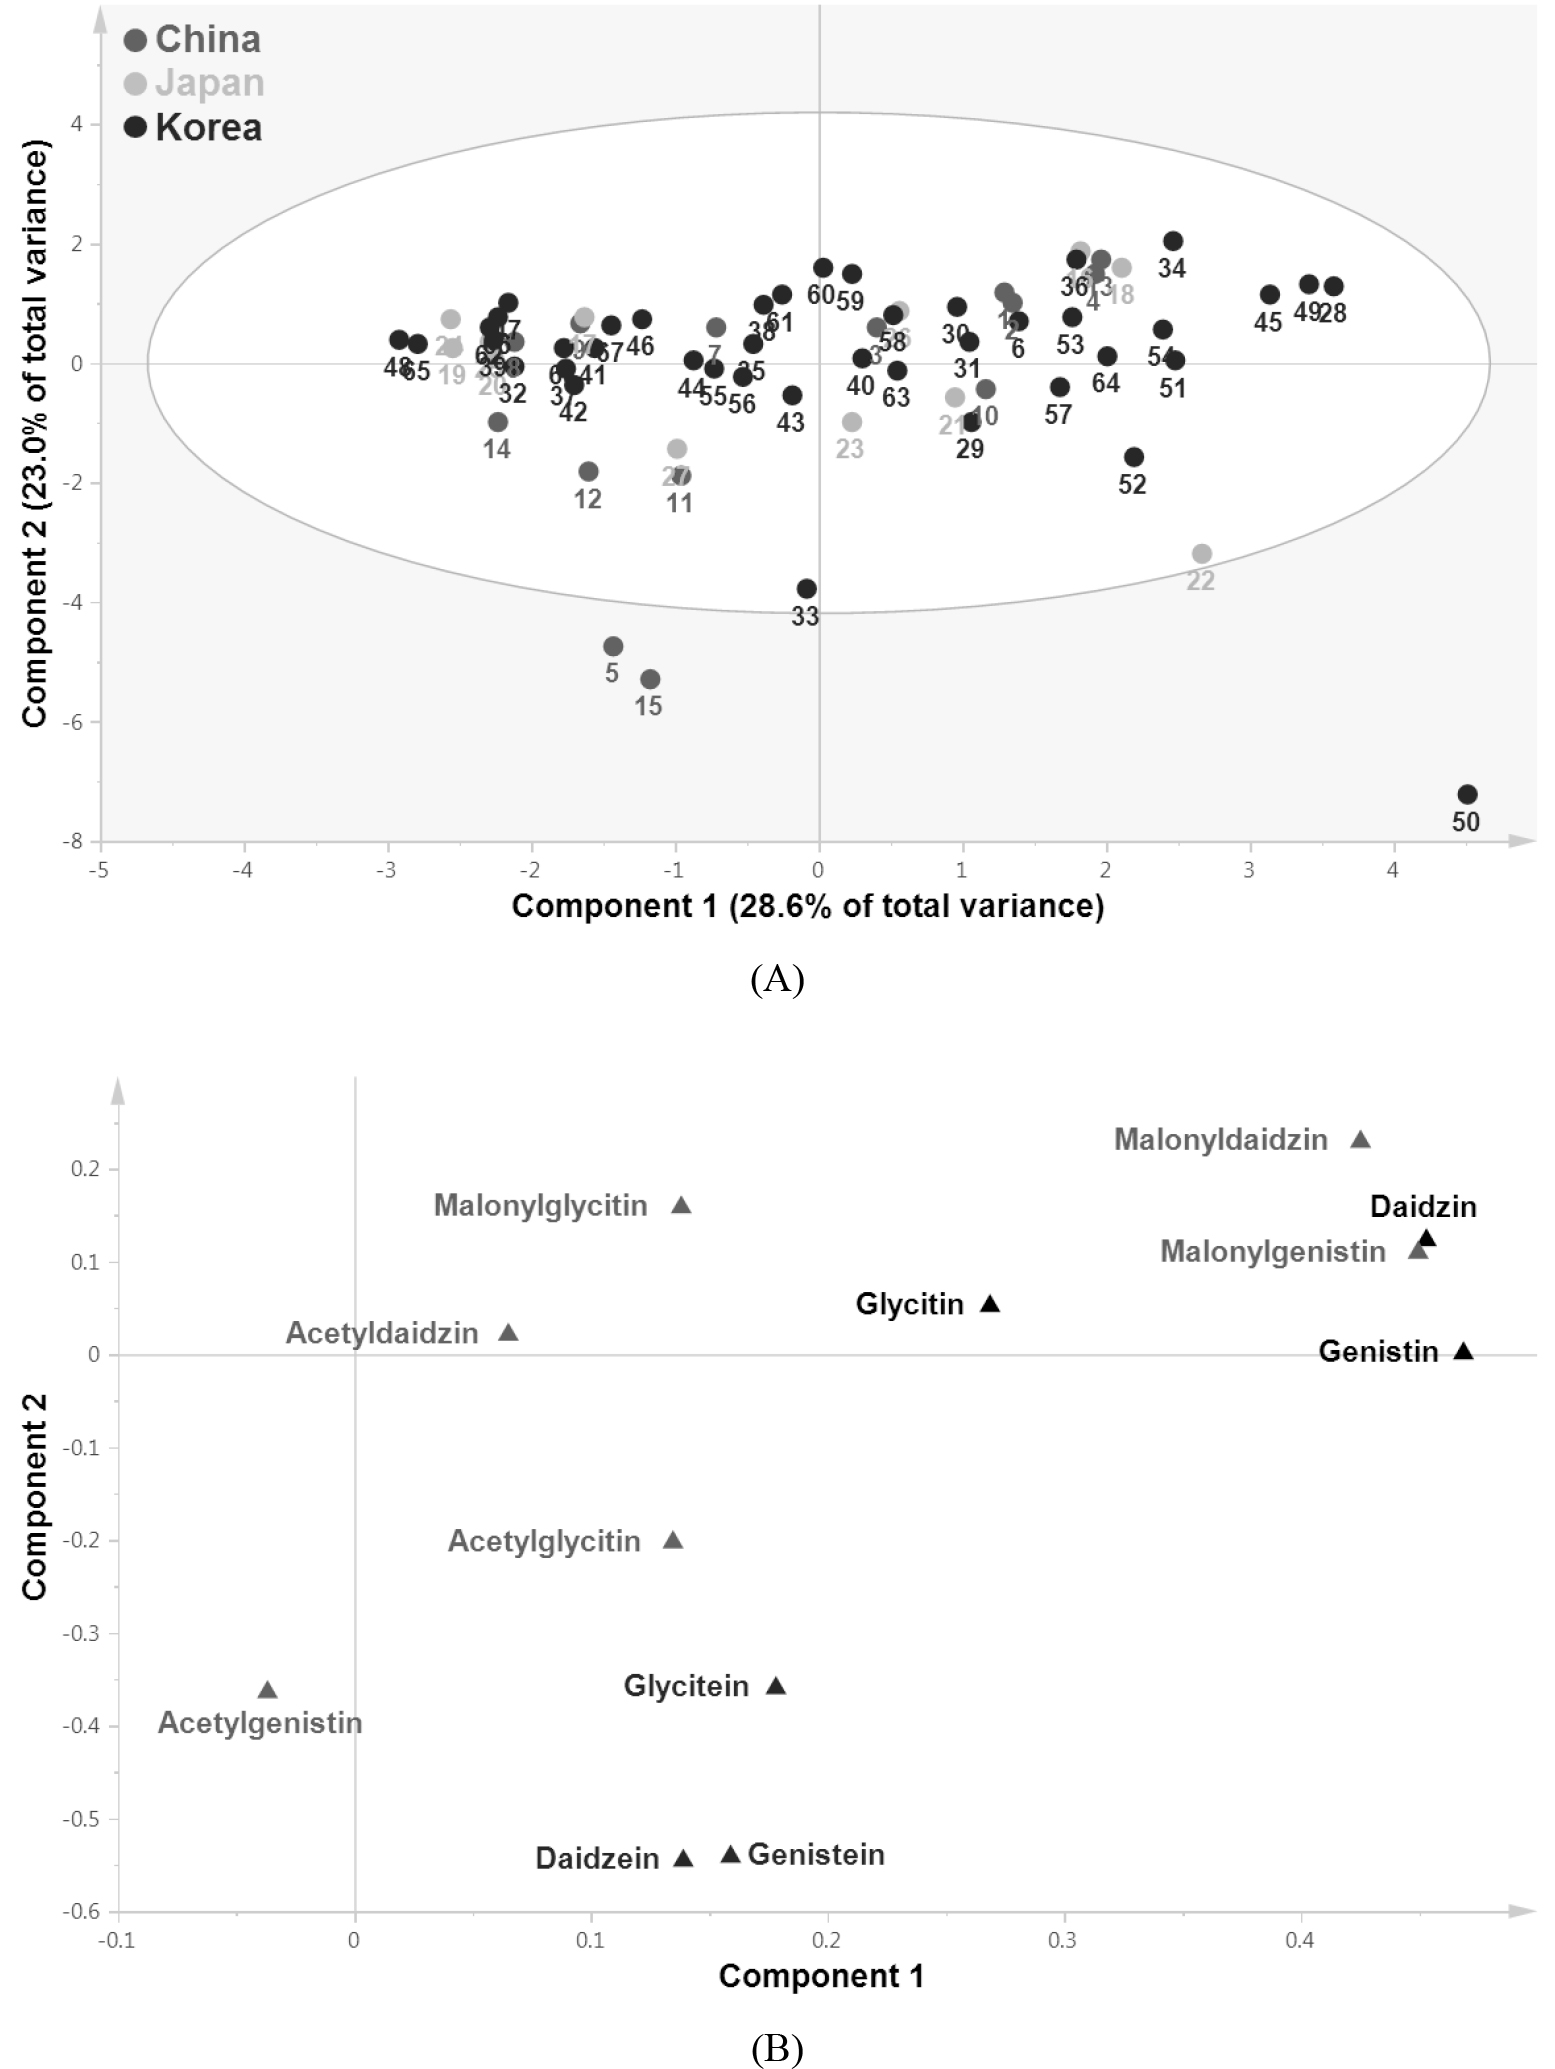
http://static.apub.kr/journalsite/sites/kjcs/2018-063-04/N0840630409/images/kjcs_63_04_09_F1.jpg
Fig. 1.

Score (A) and loading (B) [black color representing glycosides (genistin, daidzin, and glycitin); green color representing malonylglycosides (malonylgenistin, malonyldaidzin, and malonylglycitin); red color representing acetylglycosides (acetylgenistin, acetyldaidzin, and acetylglycitin), and blue color representing aglycones (genistein, daidzein, and glycitein)] plots of principal components 1 and 2 of the PCA results, for 12 isoflavones measured in 68 soybean sprout varieties. 1, CS00732; 2, CS00733; 3, CS00734; 4, CS01248; 5, CS01250; 6, CS01252; 7, CS01277; 8, CS01278; 9, CS01381; 10, CS01383; 11, CS01385; 12, CS01386; 13, CS01567; 14, CS01804; 15, CS02685; 16, CS00736; 17, CS00738; 18, CS00740; 19, CS02052; 20, CS02059; 21, CS02065; 22, CS02205; 23, CS02564; 24, CS02587; 25, CS02590; 26, CS02599; 27, CS02665; 28, CS01407; 29, CS01408; 30, CS01416; 31, CS01426; 32, CS01429; 33, CS01924; 34, CS01949; 35, CS01972; 36, CS02554; 37, CS02576; 38, CS02594; 39, CS02602; 40, CS02603; 41, CS02606; 42, CS02615; 43, CSRV001; 44, CSRV003; 45, CSRV015; 46, CSRV016; 47, CSRV017; 48, CSRV018; 49, CSRV020; 50, CSRV021; 51, CSRV022; 52, CSRV023; 53, CSRV024; 54, CSRV027; 55, CSRV029; 56, CSRV030; 57, CSRV031; 58, CSRV032; 59, CSRV033; 60, CSRV034; 61, CSRV035; 62, CSRV036; 63, CSRV037; 64, CSRV038; 65, CSRV039; 66, CSRV040; 67, CSRV041; 68, CSRV042.

However, PCA could not distinguish among the three countries of origin. Therefore, PLS-DA was conducted to enhance the weak separation obtained with the PCA model (Fig. 2). The corresponding loading indicated that the proportion of malonylglycitin was higher in most Chinese varieties than in the Korean ones, and that of malonylgenistin was higher in most Korean varieties than in Chinese varieties.
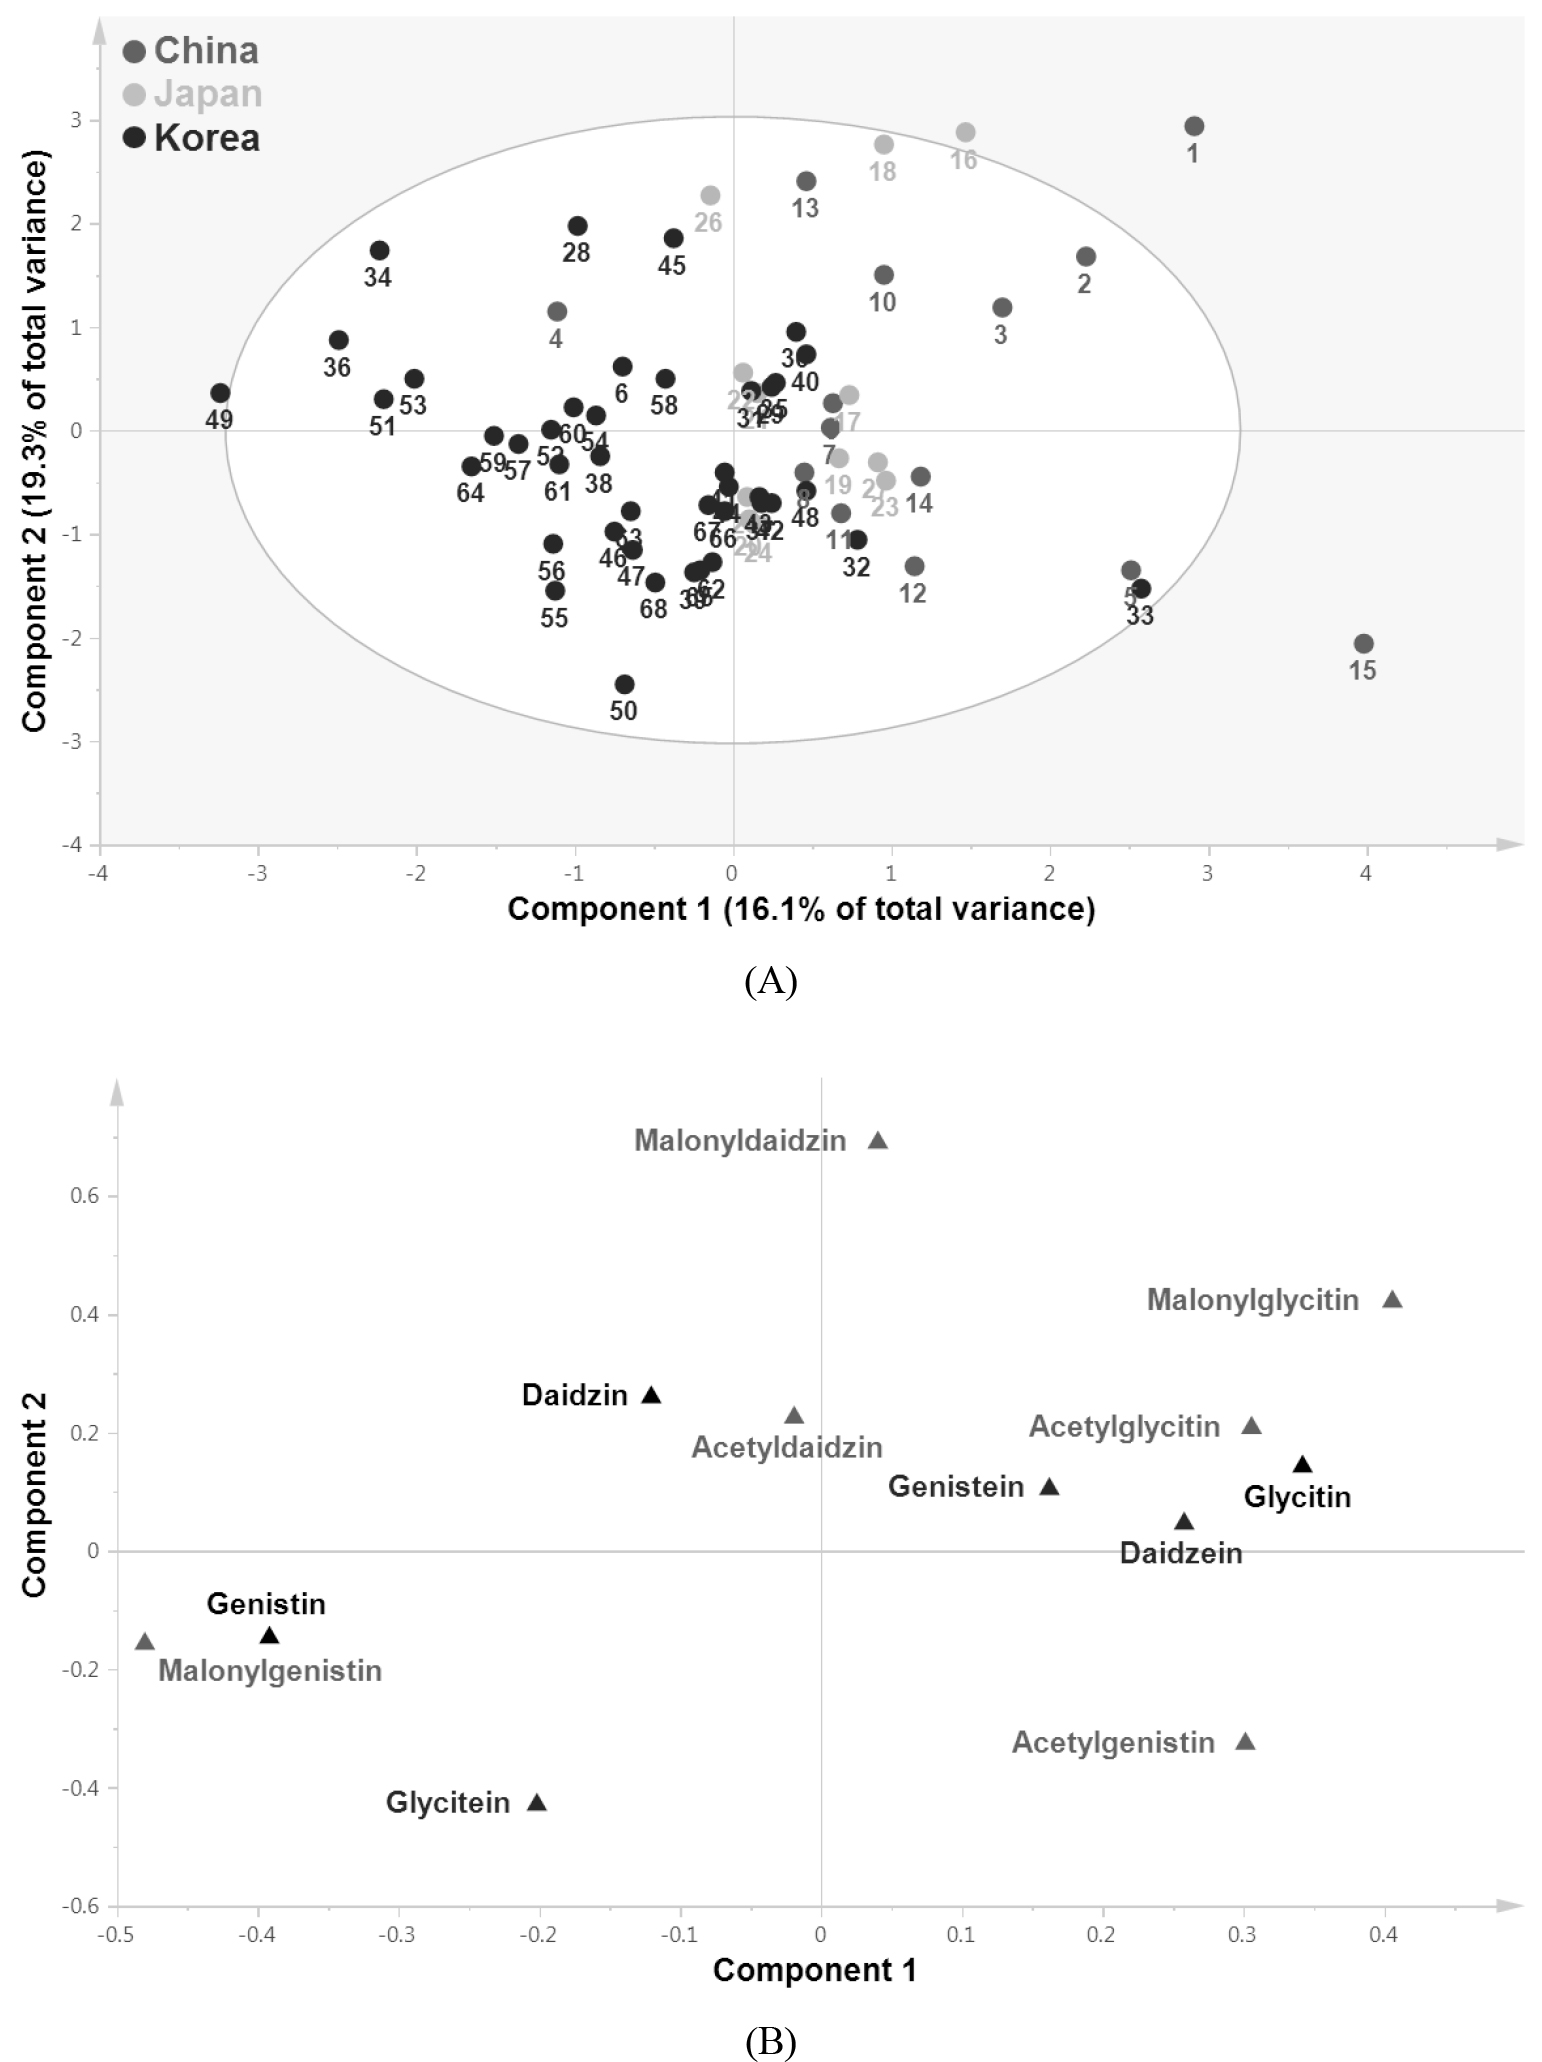
http://static.apub.kr/journalsite/sites/kjcs/2018-063-04/N0840630409/images/kjcs_63_04_09_F2.jpg
Fig. 2.

Score (A) and loading (B) [black color representing glycosides (genistin, daidzin, and glycitin); green color representing malonylglycosides (malonylgenistin, malonyldaidzin, and malonylglycitin); red color representing acetylglycosides (acetylgenistin, acetyldaidzin, and acetylglycitin), and blue color representing aglycones (genistein, daidzein, and glycitein)] plots of principal components 1 and 2 of the PLS-DA results, for 12 isoflavones measured in 68 soybean sprout varieties. The numbers of the score plots represent the same compounds as those in Fig. 1.

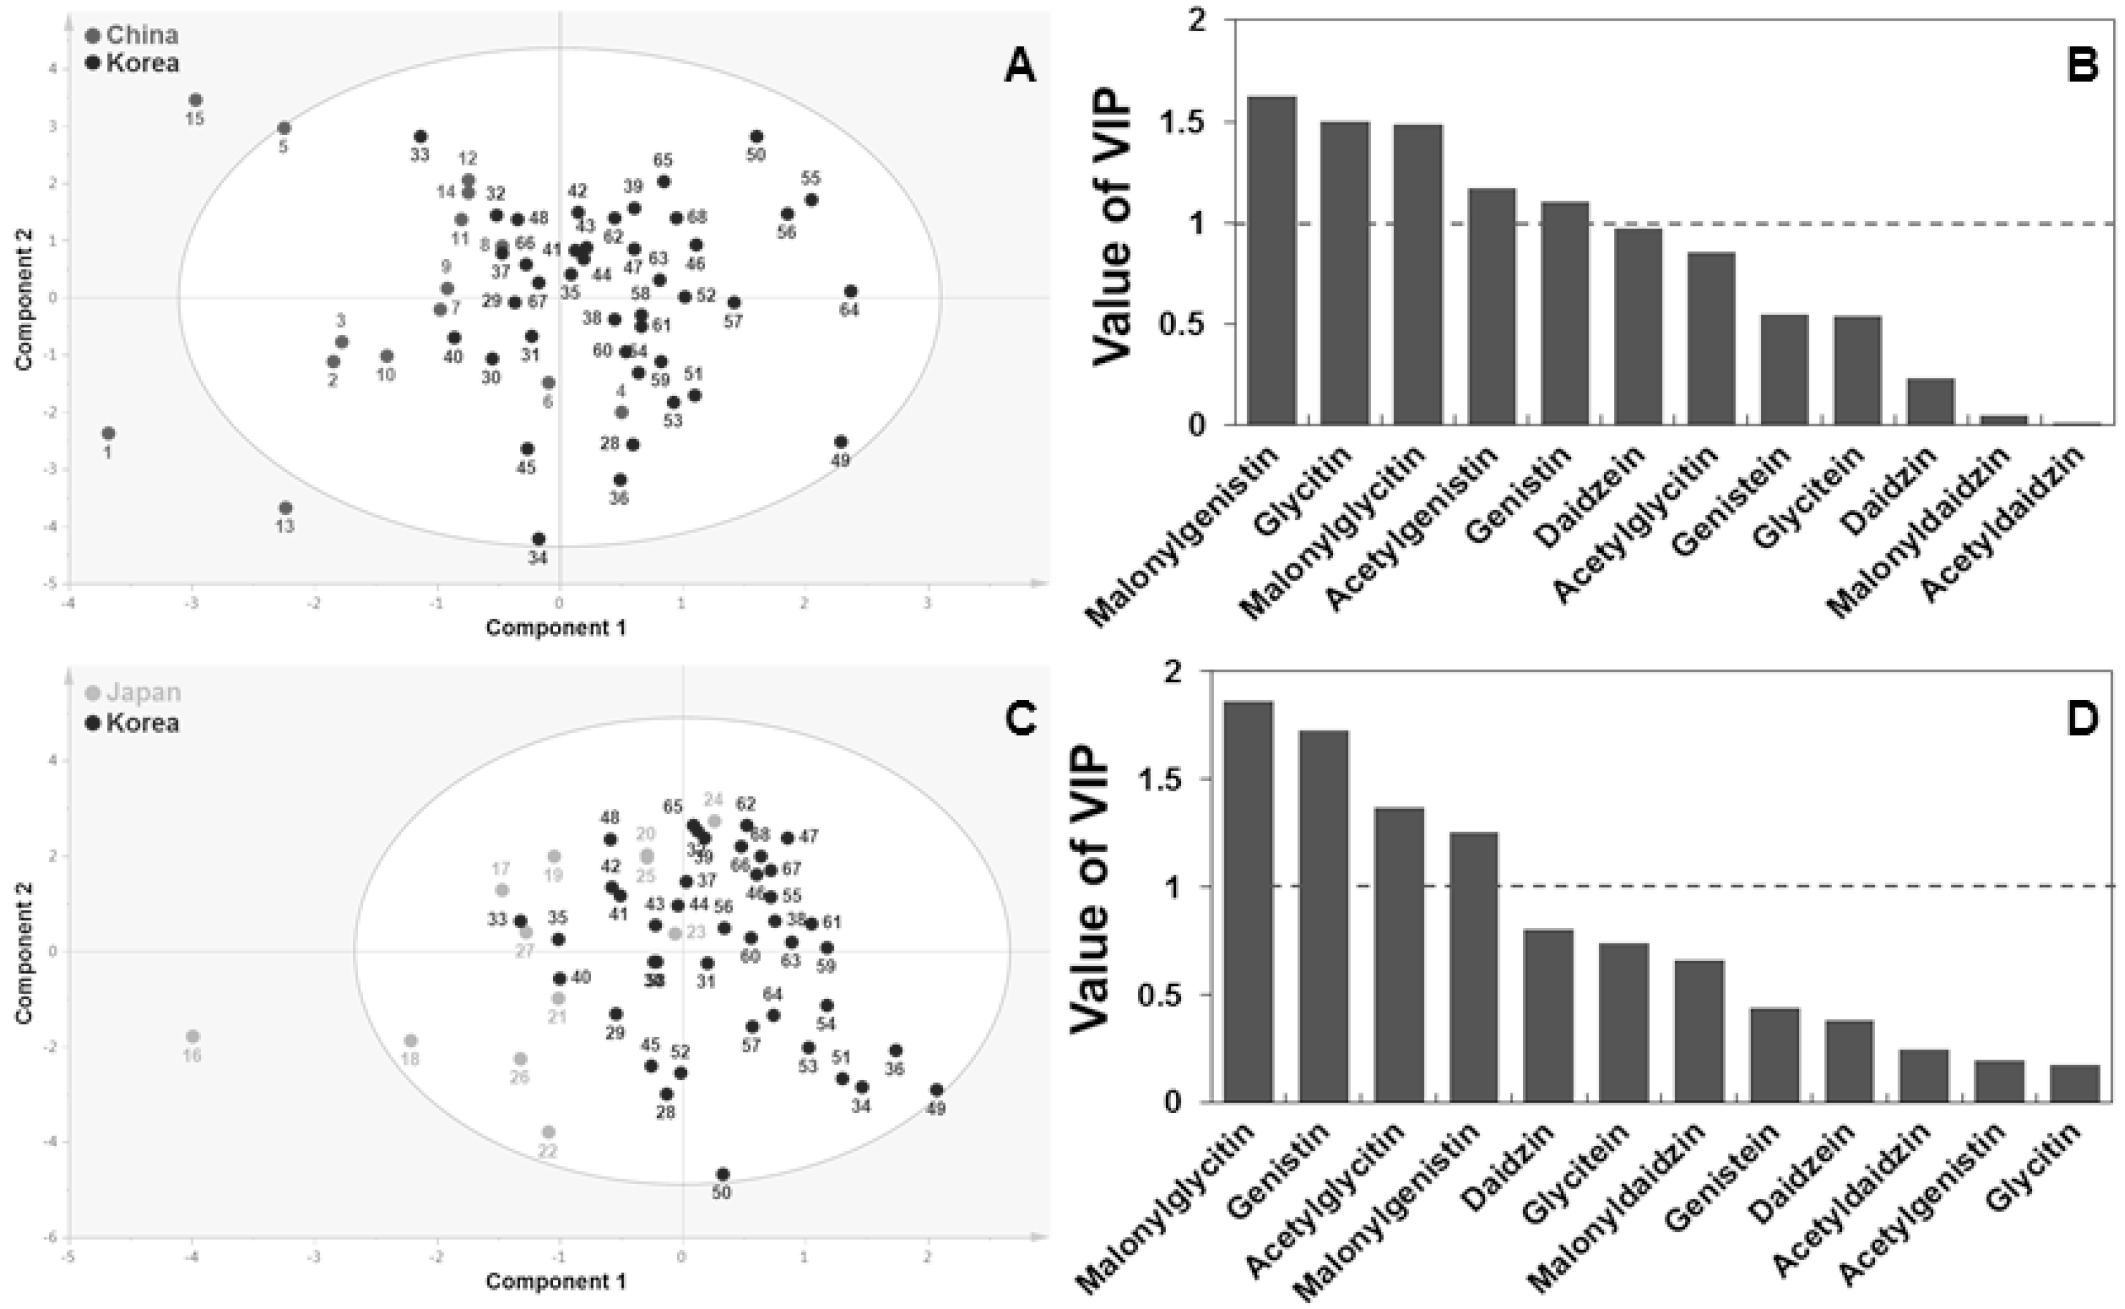
Subsequently, OPLS-DA method was applied to identify the major isoflavones responsible for the separation between Korean and Chinese or Japanese samples (Fig. 3). Because its integrated orthogonal signal correction (OSC) filter removes systematic spectral variation, OPLS-DA is often used in lieu of PLS-DA to identify a predictor for classification. The contribution of each variable to the separation was confirmed using the significance of the variable in the projection (VIP) value. VIP is a weighted sum of squares of the OPLS weight, and a value >1 is generally used as the criterion to identify the most important variables in a model. The variables that played the greatest role discriminating between Korean and Chinese samples were malonylgenistin, glycitin, malonylglycitin, acetylgenistin, and genistin (Fig. 3B). Separation between Korean and Japanese samples was mainly attributable to malonylglycitin, genistin, acetylgenistin, and malonylgenistin (Fig. 3D). These results confirmed that among 12 isoflavones, malonylglycitin, genistin, acetylgenistin, and malonylgenistin differed significantly between Korean and Chinese or Japanese samples.

http://static.apub.kr/journalsite/sites/kjcs/2018-063-04/N0840630409/images/kjcs_63_04_09_F3.jpg
Fig. 3.

OPLS-DA score plots and variable importance in the prediction (VIP) values obtained from isoflavones data sets for Korean and Chinese (A and B) and Korean and Japanese samples (C and D). The numbers of the score plots represent the same compounds as those in Fig. 1.

Correlations among isoflavone profiles by HCA and Pearson’s correlation analysis

To examine detailed relationships among the levels of the 12 isoflavones identified in soybean sprouts, Pearson’s correlation analysis and HCA on the accessions were performed. Correlation analysis is a useful technique for determining the strength of a relationship between two quantitative samples and can be used to detect associations between metabolites in a biological system. Using the methods, strong correlation was found between metabolites that participate in closely related pathways (Fig. 4), which demonstrates the robustness of the present experimental system. For example, significant positive correlation was detected between genistein and daidzein (r = 0.8902), which are synthesized by 2-hydroxyisoflavone synthase. Genistin contents were positively correlated with malonylgenistin (r = 0.8308) and daidzin (r = 0.7955). HCA results obtained from Pearson’s correlation coefficients revealed two clusters, which are marked with a dotted box in Fig. 4. One group contained glycosides and malonylglycosides, such as genistin, malonylgenistin, daidzin, and malonyldaidzin. The other group included the three aglycones (glycitein, daidzein, and genistein).
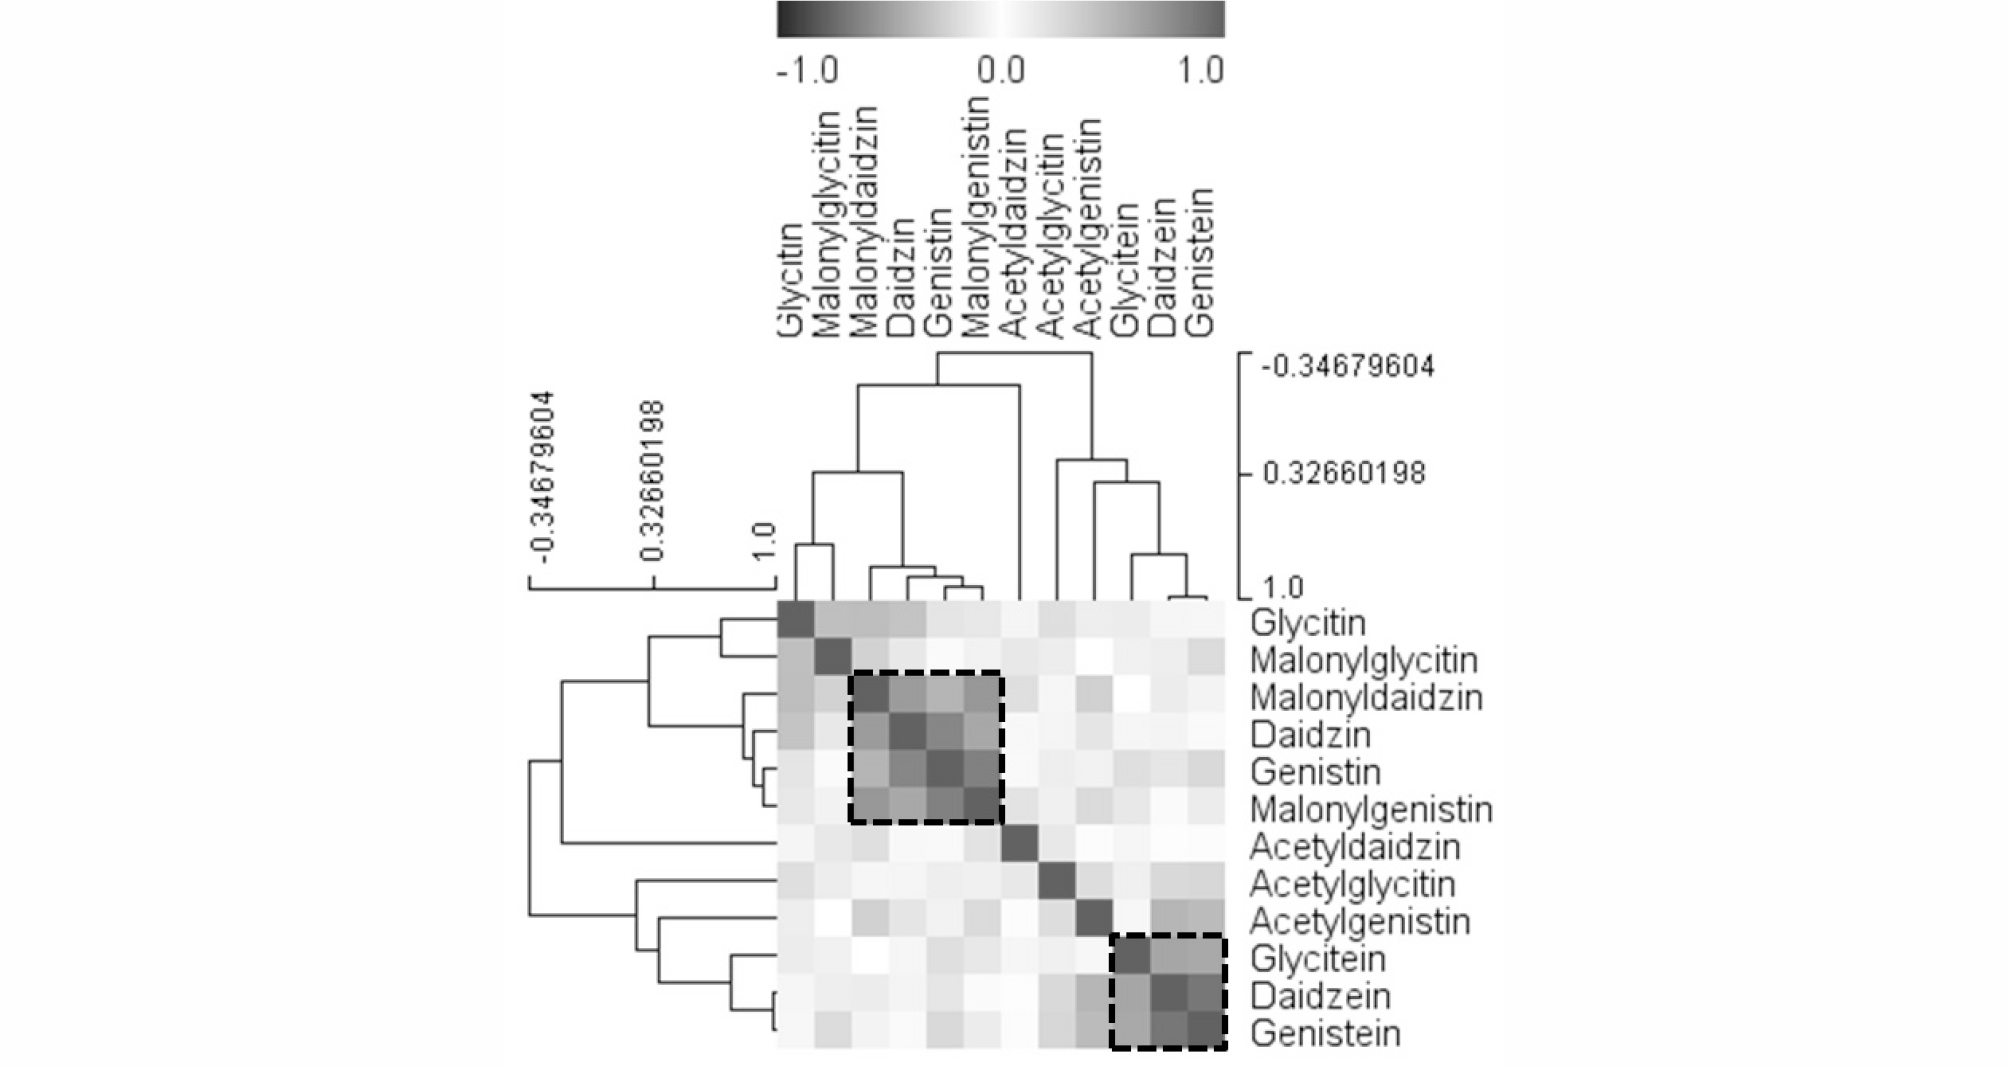
http://static.apub.kr/journalsite/sites/kjcs/2018-063-04/N0840630409/images/kjcs_63_04_09_F4.jpg
Fig. 4.

Correlation matrix and cluster analysis results obtained from data on 12 isoflavones of soybean sprouts. Each square indicates the Pearson’s correlation coefficient for a pair of compounds, and the value for the correlation coefficient is represented by the intensity of the blue or red color, as indicated on the color scale. Hierarchical clusters are represented by a cluster tree.

DISCUSSION

The isfloavone contents in soybeans are affected by environmental and genotypes (Lee et al., 2010). In previous report, the content and composition of isoflavone were reported to differ depending on soybean genotype and growth stage (Kim&Chung, 2007). And soybean isflavones showed difference according to different environmental conditions such as, rainfall, planting dates, light intensity and temperature (Kim et al., 2012). Kim et al. (Kim et al., 2012) reported that isflavone concentrations of soybeans affected by genotypes such as seed size and origins. In addition, isoflavone contents in soybean seeds were varied by commercial process in an industry and germination process (Kim et al., 2006). Other previous studies have also shown that the isoflavone concentrations in soybean seeds altered by variety, seed weight, seed color, disease tolerance (Hoeck et al., 2000; Lee et al., 2010).

The measured isoflavone compositions are consistent with previous reports. For example, Chan et al., reported that Chinese soybean sprouts contained malonylglycosides as the primary form of isoflavones (Chan et al., 2009). Lee et al., showed that glycosides and malonylglycosides were much more abundant than aglycones and acetylglycosides in Korean soybean sprouts (Lee et al., 2007). Kim et al., also reported that the malonyl-conjugated group showed highest concentrations in soybeans and soybean sprouts (Kim et al., 2006). The malonylglycosides groups is major components in soybean germplasms (Kim et al., 2012).

PLS-DA is preferred to PCA for sample discrimination, because the dimension reduction provided by PLS is guided explicitly by the among-groups variability (the origin of soybean sprouts, in this case) (Barker&Rayens, 2003; Brereton, 2009; Kim et al., 2004a,b). Although the PLS-DA results still could not clearly distinguish the countries of origin, certain trends in the separation were identified by PC1. This variation was mainly attributable to malonylglycitin and malonylgenistin.

CONCLUSIONS

This study systematically measured 12 isoflavones (glycosides, malonylglycosides, acetylglycosides, and aglycones) in soybean sprouts, and demonstrated the diversity of isoflavone contents across genetic varieties from three countries. The total isoflavone level varied widely among the different genotypes, and the malonyl-conjugated group (the sum of malonyldaidzin, malonylglycitin, and malonylgenisitin) had the highest content in most varieties. In previous reports, the malonylglycosides group of isoflavones revealed the highest in soybeans and soybean sprouts resources (Kim et al., 2006). Other previous study indicated that isoflavone concentrations are influenced by the genotype (Kim&Chung, 2007). PCA, PLS-DA, and OPLS-DA were performed to identify differences among the samples, especially with regard to the country of origin. The PCA results revealed that the CSRV021 was separated from the others by PC1 and PC2. This sample had the highest total isoflavone content among all varieties analyzed in this study. PLS-DA allowed the identification of some meaningful differences among the isoflavone profiles of samples originating from China, Japan, and Korea. The results of OPLS-DA demonstrated that among 12 isoflavones, malonylglycitin, genistin, acetylgenistin, and malonylgenistin were major isoflavones responsible for the discrimination between Korean and Chinese or Japanese samples. These conclusions suggest the usefulness of metabolite profiling combined with chemometrics as a tool for discriminating plant-based samples at the genotype level and assessing food quality. The results of this study also provide valuable information for future breeding programs, so as to increase the health benefits of isoflavones in soybean sprouts. The CSRV021 variety, which contains a relatively high level of total isoflavones, should be of high dietary value. In conclusion, our results are similar to those of previous results that have observed that isoflavones in soybean sprouts are affected by genotypes. And the results of this study will be helpful to plant breeder and genetists for further investigating the basis of genetic control and selection of soybean isoflavones.

Supplementary Appendix

Supplementary Appendix 1. Content (µg/g dry weight) of Three Glycosides in Soybean Sproutsa.

IT No.OriginDaidzinGlycitinGenistin% b
CS00732China125.27±4.8925.67±0.14116.41±0.9022.31
CS00733China72.43±0.6347.63±0.17111.82±1.2423.23
CS00734China89.96±0.7330.06±0.27108.48±1.5526.30
CS01248China134.64±0.6120.12±2.15162.31±0.8830.56
CS01250China44.20±0.279.75±0.0854.19±0.0411.78
CS01252China156.27±1.0420.11±0.07171.06±0.0638.46
CS01277China100.92±6.9726.88±0.2784.47±0.6034.19
CS01278China66.52±1.4212.18±0.2151.16±0.1430.51
CS01381China65.01±0.1315.63±0.2352.57±0.4726.51
CS01383China110.04±0.5623.65±0.1892.03±0.1524.60
CS01385China69.36±1.1310.70±0.41112.73±0.2826.64
CS01386China50.41±0.7513.71±0.0193.45±0.3223.05
CS01567China122.84±1.4740.86±3.34103.92±1.9225.71
CS01804China25.13±0.328.24±0.8970.33±0.4923.10
CS02685China66.55±0.6421.55±0.0886.98±0.9417.98
CS00736Japan110.15±0.7120.84±0.12126.44±0.8319.52
CS00738Japan65.79±0.6010.76±0.1250.22±0.1421.84
CS00740Japan98.37±0.6434.47±5.73107.90±1.2821.15
CS02052Japan47.47±0.336.16±0.5132.41±0.1822.12
CS02059Japan54.44±0.754.28±0.1091.15±0.9536.30
CS02065Japan88.15±0.8813.57±0.39128.91±1.3722.44
CS02205Japan139.39±0.417.76±0.00196.26±0.6925.50
CS02564Japan99.38±0.0926.08±0.23110.35±0.2725.53
CS02587Japan74.87±0.0511.44±0.0853.59±0.2439.90
CS02590Japan44.83±0.126.43±0.0156.96±0.1724.18
CS02599Japan73.92±0.4412.60±0.5980.21±0.2719.31
CS02665Japan46.06±0.3414.38±0.3463.06±0.9017.50
CS01407Korea176.80±8.8225.34±0.07175.04±0.7229.47
CS01408Korea153.57±4.8514.49±3.07126.84±1.6431.57
CS01416Korea141.88±0.0229.70±0.21118.97±0.5736.36
CS01426Korea140.39±0.7126.18±0.18145.81±0.2735.96
CS01429Korea69.06±1.8119.49±4.1371.76±0.7035.89
CS01924Korea52.25±1.5822.92±0.37114.65±0.6917.54
CS01949Korea146.66±0.9118.40±1.06163.70±1.0828.65
CS01972Korea76.05±0.9112.37±0.2896.00±0.0227.37
CS02554Korea125.06±0.7312.31±0.01179.95±0.8429.43
CS02576Korea45.02±1.3714.80±0.5570.54±0.5322.94
CS02594Korea92.04±0.1512.51±0.03131.71±0.2434.04
CS02602Korea42.64±0.516.85±0.2285.58±0.1125.82
CS02603Korea72.11±0.0418.53±0.0179.33±0.3217.60
CS02606Korea49.37±0.326.41±0.3672.11±0.4520.69
CS02615Korea40.12±0.719.13±0.0365.73±0.9420.18
CSRV001Korea61.57±0.2321.05±0.19103.55±0.3925.07
CSRV003Korea78.17±0.3811.84±0.2794.88±1.0226.33
CSRV015Korea135.38±0.2734.24±0.33163.55±0.2227.31
CSRV016Korea52.07±0.4910.49±0.18107.63±0.4526.37
CSRV017Korea45.44±0.1010.09±0.3680.59±0.1027.16
CSRV018Korea31.00±0.376.59±0.2444.00±0.4425.08
CSRV020Korea154.42±0.4412.24±0.07216.59±0.9827.47
CSRV021Korea103.75±0.6025.87±2.41187.85±1.1820.44
CSRV022Korea156.49±2.188.25±0.09194.38±2.2727.96
CSRV023Korea104.43±1.7110.95±0.14173.16±0.2923.44
CSRV024Korea116.66±2.879.70±0.67172.88±0.7226.12
CSRV027Korea181.36±1.1228.89±0.26176.14±2.4935.98
CSRV029Korea33.59±2.376.57±0.99122.11±3.2419.50
CSRV030Korea36.33±0.234.89±1.12120.25±0.5719.33
CSRV031Korea158.54±0.046.59±0.10188.95±0.5634.21
CSRV032Korea85.31±4.2416.29±1.35117.06±0.9524.84
CSRV033Korea96.60±0.2613.49±0.11140.10±0.6930.70
CSRV034Korea93.98±2.5015.13±0.46116.86±1.0328.57
CSRV035Korea99.23±0.4013.79±1.37125.38±0.7731.60
CSRV036Korea61.51±0.7011.56±0.2069.55±0.0933.67
CSRV037Korea107.75±1.4820.94±0.47146.28±0.9333.25
CSRV038Korea135.56±0.578.59±0.04192.67±0.8329.49
CSRV039Korea35.02±0.902.85±0.1458.69±0.4423.18
CSRV040Korea66.94±1.5013.01±0.0861.82±0.3732.61
CSRV041Korea69.41±0.7518.13±0.1592.15±0.5633.49
CSRV042Korea37.79±2.247.01±1.58107.46±0.4925.25

aEach value represents the mean ± standard deviation (n = 2).
bPercentage of three glycosides to total isoflavones.

Supplementary Appendix 2. Content (µg/g dry weight) of Three Malonylglycosides in Soybean Sproutsa.

IT No.OriginMalonyldaidzinMalonylglycitinMalonylgenistin% b
CS00732China131.84±1.47400.08±3.38221.19±3.1862.84
CS00733China107.84±0.73188.83±2.05386.99±2.3168.49
CS00734China105.44±1.63170.97±9.57243.24±0.6559.81
CS01248China181.39±0.5946.45±0.01431.17±1.2863.51
CS01250China59.60±0.0915.18±0.94116.32±0.8520.82
CS01252China126.31±0.5839.64±0.51271.53±0.0648.43
CS01277China86.60±0.0341.14±0.20172.37±0.6848.36
CS01278China82.87±0.4224.75±0.83104.63±0.6349.87
CS01381China101.25±0.0534.63±1.82154.87±0.3657.86
CS01383China187.62±0.7852.23±0.67246.51±1.7652.99
CS01385China53.77±0.2018.15±0.11166.07±0.9932.88
CS01386China38.73±0.0116.69±0.07169.24±0.0132.87
CS01567China200.45±1.7792.04±1.75 388.53±0.3465.42
CS01804China33.88±0.0213.61±0.57141.84±1.5442.17
CS02685China28.05±0.2728.75±0.6676.99±0.6713.74
CS00736Japan179.23±0.36369.41±5.74405.25±1.1272.34
CS00738Japan101.65±1.33100.69±1.04178.32±1.0865.56
CS00740Japan221.82±6.42160.04±1.70435.77±3.3571.84
CS02052Japan89.19±0.1221.99±0.07114.88±1.0358.12
CS02059Japan46.88±0.1114.32±0.92120.95±0.2645.02
CS02065Japan126.63±1.8732.07±0.37439.88±0.2258.24
CS02205Japan133.53±0.3724.48±0.98396.49±0.3741.18
CS02564Japan104.64±1.0039.52±0.26260.36±0.7143.80
CS02587Japan45.32±0.2521.15±0.62100.13±0.8947.52
CS02590Japan78.08±0.1119.35±0.31173.38±0.8160.52
CS02599Japan174.43±0.3138.13±0.09383.81±0.3469.08
CS02665Japan94.98±0.0926.29±0.57230.69±1.0349.89
CS01407Korea210.36±1.1946.61±0.30545.38±1.5562.70
CS01408Korea120.56±1.5019.67±0.76243.16±4.1941.04
CS01416Korea125.85±0.6140.38±0.25266.22±3.2254.12
CS01426Korea111.23±0.5932.44±0.74277.49±0.6948.48
CS01429Korea37.57±1.2321.70±0.5594.83±0.2334.51
CS01924Korea52.00±0.1627.54±0.51313.64±2.3836.34
CS01949Korea214.18±0.6620.76±0.55506.55±2.6164.63
CS01972Korea117.38±0.6932.87±0.27255.40±2.5060.20
CS02554Korea168.17±1.8127.28±0.03491.72±0.8763.74
CS02576Korea61.70±0.2331.88±0.52203.18±0.1952.23
CS02594Korea105.54±0.5728.65±0.59256.67±1.4356.31
CS02602Korea19.42±0.3869.09±0.86229.76±2.5560.85
CS02603Korea168.75±0.2065.04±1.64363.57±0.3761.86
CS02606Korea93.31±0.4051.88±2.20241.49±0.0462.56
CS02615Korea72.91±0.4831.97±2.85226.81±1.0158.22
CSRV001Korea87.32±0.5060.36±0.98266.40±1.2455.75
CSRV003Korea86.33±0.6637.52±7.64258.40±0.8654.42
CSRV015Korea216.47±1.4871.00±0.11483.45±2.8463.20
CSRV016Korea72.53±0.2331.78±0.16311.62±1.7464.44
CSRV017Korea62.09±0.7226.96±0.64229.69±2.2763.60
CSRV018Korea50.82±0.0622.98±0.48116.38±1.4958.46
CSRV020Korea177.65±0.8241.91±0.26685.69±2.3764.88
CSRV021Korea102.40±0.1132.55±1.19466.74±0.8938.74
CSRV022Korea140.61±0.2225.45±1.51557.33±1.3156.33
CSRV023Korea135.27±0.8234.41±0.65523.92±3.7456.34
CSRV024Korea161.63±2.9731.27±0.22508.14±2.4061.17
CSRV027Korea112.36±3.6845.02±1.42384.70±0.0250.48
CSRV029Korea73.64±6.3622.05±0.48457.31±0.7166.44
CSRV030Korea75.99±0.5918.82±1.76468.74±1.3767.48
CSRV031Korea84.73±0.6021.84±8.33410.61±0.1549.96
CSRV032Korea150.11±2.9836.78±8.66399.06±0.4666.56
CSRV033Korea119.29±0.5935.60±0.49370.40±0.0364.45
CSRV034Korea131.51±2.1651.48±9.85348.79±4.6967.23
CSRV035Korea92.76±0.6629.34±1.87328.18±2.1059.68
CSRV036Korea50.31±0.3226.72±0.21144.99±0.1352.43
CSRV037Korea75.06±2.5634.26±0.55302.59±2.9249.81
CSRV038Korea104.77±0.6226.68±0.19546.17±0.2259.32
CSRV039Korea39.71±0.0715.65±0.40201.89±0.0361.75
CSRV040Korea50.75±0.0125.92±1.72148.34±1.3951.75
CSRV041Korea51.40±0.1726.67±0.36201.61±1.2752.13
CSRV042Korea34.25±0.3425.34±3.44296.91±0.9459.11

aEach value represents the mean ± standard deviation (n = 2).
bPercentage of three malonylglycosides to total isoflavones.

Supplementary Appendix 3. Content (µg/g dry weight) of Three Acetylglycosides in Soybean Sproutsa.

IT No.OriginAcetyldaidzinAcetylglycitinAcetylgenistin% b
CS00732China3.77±0.016.65±0.1850.38±3.225.07
CS00733China4.18±0.1511.81±0.0323.11±0.243.92
CS00734China4.72±0.228.09±0.5739.61±2.916.03
CS01248China2.94±0.035.27±0.127.60±0.691.52
CS01250China5.79±0.064.53±0.10124.71±0.8014.71
CS01252China2.96±0.084.48±0.066.47±0.071.54
CS01277China2.26±0.233.03±0.2713.64±0.383.05
CS01278China2.88±0.023.15±0.047.28±0.143.13
CS01381China5.85±0.214.64±0.017.91±0.333.66
CS01383China6.30±0.968.02±0.6826.89±3.824.49
CS01385China5.73±0.075.19±0.6745.75±0.667.83
CS01386China3.74±0.105.00±0.1478.16±0.1012.71
CS01567China10.58±0.692.99±0.1617.16±0.002.95
CS01804China11.32±0.6411.01±1.1230.97±0.4611.87
CS02685China6.54±0.477.03±0.06303.65±0.1532.58
CS00736Japan1.73±0.034.62±0.3728.68±1.602.66
CS00738Japan2.70±0.164.62±0.173.31±0.741.83
CS00740Japan3.87±0.016.95±0.278.38±1.101.69
CS02052Japan2.94±0.135.77±0.136.68±0.183.96
CS02059Japan2.98±0.006.77±0.250.24±0.032.47
CS02065Japan3.29±0.2511.55±0.3442.45±0.515.57
CS02205Japan4.53±0.259.41±0.2252.22±1.854.91
CS02564Japan4.74±0.133.81±0.18112.90±1.7813.15
CS02587Japan1.67±0.032.43±0.124.75±1.182.52
CS02590Japan4.93±0.454.32±0.0117.92±0.046.07
CS02599Japan23.24±1.078.89±1.381.89±0.253.94
CS02665Japan2.27±0.436.94±0.114.09±1.191.89
CS01407Korea2.62±0.049.66±0.164.63±0.411.32
CS01408Korea3.03±0.528.01±0.8430.27±0.264.42
CS01416Korea2.66±0.118.02±0.0813.86±0.533.07
CS01426Korea1.31±0.006.72±0.1529.61±0.664.33
CS01429Koreatrace3.07±0.8317.75±0.174.66
CS01924Korea5.64±0.4110.68±0.19222.31±2.3022.05
CS01949Korea15.43±0.31trace8.62±0.232.10
CS01972Korea4.03±0.149.60±0.202.93±0.012.46
CS02554Korea14.39±0.16trace5.49±0.701.84
CS02576Korea6.88±0.242.33±0.025.53±0.942.60
CS02594Korea5.60±0.093.13±0.0318.88±0.253.98
CS02602Korea4.82±0.143.10±0.1412.95±0.083.99
CS02603Korea7.75±0.234.44±0.1263.14±4.087.80
CS02606Korea5.56±0.193.98±0.0518.57±1.604.55
CS02615Korea5.37±0.165.71±0.2912.86±1.494.20
CSRV001Korea5.73±0.065.94±0.0514.40±0.263.51
CSRV003Korea4.68±0.034.65±0.0241.07±1.207.18
CSRV015Korea3.58±0.156.85±0.2711.77±0.801.82
CSRV016Korea2.84±0.223.71±0.399.43±2.612.47
CSRV017Korea3.71±0.240.49±0.008.50±0.292.53
CSRV018Korea7.70±0.055.37±1.714.74±1.275.47
CSRV020Korea7.58±0.052.15±0.077.18±0.061.21
CSRV021Korea7.88±0.287.03±0.135.85±1.151.34
CSRV022Korea6.16±0.212.39±0.3020.70±0.112.28
CSRV023Korea2.67±0.116.14±0.376.18±1.331.22
CSRV024Korea8.41±0.792.41±0.238.61±0.831.70
CSRV027Korea3.14±0.185.85±0.3920.95±0.472.79
CSRV029Korea2.45±0.124.90±0.0534.14±1.174.99
CSRV030Korea4.32±0.146.56±1.029.22±1.372.41
CSRV031Korea3.50±0.148.88±1.0410.09±2.202.17
CSRV032Korea2.20±0.036.57±0.01trace1.00
CSRV033Korea7.80±0.192.18±0.297.81±0.452.18
CSRV034Korea4.69±0.092.50±0.072.75±0.281.26
CSRV035Korea5.59±0.222.47±0.148.26±0.182.16
CSRV036Korea2.10±0.062.15±0.0612.09±1.583.86
CSRV037Korea3.89±0.215.19±0.316.28±0.251.86
CSRV038Korea3.35±0.0310.34±0.0233.79±0.854.16
CSRV039Korea3.22±0.114.26±0.099.48±0.454.07
CSRV040Korea6.91±0.101.65±0.038.59±0.493.94
CSRV041Korea8.38±0.392.86±0.6614.43±0.984.78
CSRV042Korea9.20±0.055.30±0.1054.81±9.0611.48

aEach value represents the mean ± standard deviation (n = 2).
bPercentage of three acetylglycosides to total isoflavones.

Supplementary Appendix 4. Content (µg/g dry weight) of Three Aglycones in Soybean Sproutsa.

IT No.OriginDaidzeinGenisteinGlycitein% b
CS00732China109.45±0.442.68±0.055.07±0.319.78
CS00733China36.93±0.282.54±0.194.10±0.134.37
CS00734China52.27±1.153.39±0.0212.56±0.347.85
CS01248China28.88±0.031.74±0.0515.19±0.334.41
CS01250China404.84±0.898.94±0.1070.00±0.0052.70
CS01252China80.33±0.322.76±0.0221.36v0.4911.56
CS01277China71.23±0.442.31±0.0415.84±0.0114.40
CS01278China49.12±0.024.01±0.0417.03±0.2216.49
CS01381China45.93±0.282.12±0.0412.11±1.8911.97
CS01383China123.87±0.749.72±0.5430.92±0.4317.93
CS01385China179.73±0.114.09±0.0152.47±0.2532.65
CS01386China169.43±0.222.11±0.0042.88±0.1531.37
CS01567China43.47±0.761.95±0.0216.25±0.715.92
CS01804China74.36±0.022.38±0.0925.95±0.8822.87
CS02685China260.48±0.873.29±0.2083.88±1.0435.70
CS00736Japan57.14±0.091.94±0.1313.26±0.585.49
CS00738Japan48.77±0.183.37±0.0210.40±0.1810.77
CS00740Japan37.57±1.521.92±0.1321.08±0.105.32
CS02052Japan44.90±0.143.13±0.0013.43±0.5215.80
CS02059Japan49.93±0.311.74±0.0613.92±0.2316.21
CS02065Japan109.50±0.472.53±0.0129.22±0.2913.74
CS02205Japan285.85±0.964.73±0.0891.99±0.4328.41
CS02564Japan123.45±0.115.29±0.0233.07±0.5317.52
CS02587Japan25.39±0.341.96±0.017.91±0.2810.06
CS02590Japan21.25±0.813.23±0.0616.82±2.229.23
CS02599Japan48.96±1.743.80±0.0613.42±0.127.67
CS02665Japan164.00±1.708.04±0.2244.71±0.4430.72
CS01407Korea66.05±0.083.19±0.2013.98±0.026.50
CS01408Korea176.45±0.186.78±0.0431.36±1.5322.97
CS01416Korea39.96±0.352.82±0.198.79±1.176.45
CS01426Korea75.06±0.632.15±0.1020.28±1.4211.22
CS01429Korea92.97±1.261.92±0.0516.44±0.6324.94
CS01924Korea193.98±0.873.24±0.1263.13±0.0324.06
CS01949Korea36.13±0.222.15±0.0414.72±0.504.62
CS01972Korea48.94±0.163.48±0.0414.77±0.339.97
CS02554Korea34.68±0.042.24±0.0516.83±0.764.98
CS02576Korea100.13±0.364.63±0.3621.62±0.9022.24
CS02594Korea26.53±0.583.30±0.159.52±0.165.67
CS02602Korea33.80±1.623.52±0.0411.52±0.239.34
CS02603Korea94.70±0.245.16±0.5823.10±0.0412.73
CS02606Korea51.55±3.094.85±0.0919.04±0.5912.20
CS02615Korea66.06±0.026.59±0.1226.48±0.5117.40
CSRV001Korea77.37±0.3114.33±0.1824.75±1.8615.68
CSRV003Korea61.57±0.564.62±0.1318.58±0.4612.07
CSRV015Korea70.70±0.205.65±0.7717.11±0.137.66
CSRV016Korea30.15±0.483.03±0.0610.17±0.416.72
CSRV017Korea26.34±1.071.96±0.015.28±0.136.70
CSRV018Korea22.60±0.282.15±0.1311.00±0.0210.99
CSRV020Korea64.78±0.087.25±0.0517.75±0.726.43
CSRV021Korea432.70±0.7355.24±0.17125.35±0.8839.49
CSRV022Korea120.94±1.921.75±0.0249.79±1.0013.43
CSRV023Korea143.64±0.268.22±0.1482.11±5.1019.00
CSRV024Korea98.26±0.563.50±0.0624.87±34.0911.01
CSRV027Korea102.16±1.709.18±0.144.04±0.1710.74
CSRV029Korea44.25±0.474.77±0.2026.49±0.579.07
CSRV030Korea51.83±0.114.44±0.0633.80±0.0910.78
CSRV031Korea100.56±0.464.16±0.1336.64±0.1813.66
CSRV032Korea49.03±0.683.18±0.1114.80±1.047.61
CSRV033Korea14.01±0.003.67±0.104.12±0.492.67
CSRV034Korea15.87±0.743.15±1.184.29±0.492.94
CSRV035Korea41.47±0.522.28±0.105.76±0.086.56
CSRV036Korea33.13±0.585.11±0.144.27±0.3210.04
CSRV037Korea98.47±0.2610.91±0.3215.36±0.2515.08
CSRV038Korea55.89±0.195.18±0.1519.31±0.457.04
CSRV039Korea33.43±0.092.32±0.1910.09±0.1011.00
CSRV040Korea44.63±1.273.18±0.063.09±0.0511.70
CSRV041Korea41.27±1.544.08±0.186.13±0.369.59
CSRV042Korea17.04±0.082.72±0.315.35±0.014.16

aEach value represents the mean ± standard deviation (n = 2).
bPercentage of three aglycones to total isoflavones.

Acknowledgements

This work was carried out with the support of “Cooperative Research Program for Agriculture Science and Technology Development (Project No. PJ01183302)” Rural Development Administration, Republic of Korea.

References

1
Adlercreutz, H. and Mazur, W. 1997. Phyto-oestrogens and western diseases. Ann. Med. 29 : 95-120.
10.3109/078538997091136969187225
2
Allred, C. D., K. F. Allred, Y. H. Ju, T. S. Geoppinger, D. R. Doerge, and W. G. Helferich. 2005. Soy processing influences growth of estrogen dependent breast cancer tumors. Carcinogenesis 25 : 1649-1657.
10.1093/carcin/bgh17815131010
3
Anthony, M. S., T. B. Clarkson, and C. L. Hughes. 1996. Soybean isoflavones improve cardiovascular risk factors without affecting the reproductive system of peripubertal rhesus monkeys. J. Nutr. 126 : 43-50.
10.1093/jn/126.1.438558324
4
Barker, M. and W. Rayens. 2003. Partial least squares for discrimination. J. Chemom. 17 : 166-173.
10.1002/cem.785
5
Barnes, S. 2010. The biochemistry, chemistry and physiology of the isoflavones in soybeans and their food products. Lymphat. Res. Biol. 8 : 89-98.
10.1089/lrb.2009.003020235891PMC2883528
6
Brereton, R. G. 2009. Validation and optimization. In Chemometrics for pattern recognition; Wiley: Chichester, UK, pp. 311-391.
10.1002/9780470746462.ch8
7
Caldwell, C. R., S. J. Britz, and R. M. Mirecki. 2005. Effect of temperature, elevated carbon dioxide, and drought during seed development on the isoflavone content of dwarf soybean (Glycine max (L.) Merrill) grown in controlled environments. J. Agric. Food Chem. 53 : 1125 -1129.
10.1021/jf035535115713029
8
Carrao-Panizzi, M. C., M. Berhow, J. M. G. Mandarino, and M. C. N. Oliveira. 2009. Environmental and genetic variation of isoflavone content of soybean seeds grown in Brazil. Pesq. Agropec. Bras. 44 : 1444-1451.
10.1590/S0100-204X2009001100011
9
Chan, S. G., P. A. Murphy, S. C. Ho, N. Kreiger, G. Darlington, E. K. F. So, and P. Y. Y. Chong. 2009. Isoflavonoid content of Hong Kong soy foods. J. Agric. Food Chem. 57 : 5386- 5390.
10.1021/jf803870k19530716
10
Hoeck, J. A., W. R. Fehr, P. A. Murphy, and G. A. Welke. 2000. Influence of genotype and environment on isoflavone contents of soybean. Crop Sci. 40 : 48-51.
10.2135/cropsci2000.40148x
11
Hwang, Y. H. 2004. Present status and future developmental direction of soy-related industries in Korea. Kor. Soybean Digest. 21 : 28-44.
12
Kim, E. H., S. H. Kim, J. I. Chung, H. Y. Chi, J. A. Kim, and I. M. Chung. 2006. Analysis of phenolic compounds and isoflavones in soybean seeds (Glycine max L. Merrill) and sprouts grown under different conditions. Eur. Food Res. Technol. 222 : 201-208.
10.1007/s00217-005-0153-4
13
Kim, E. H., H. M. Ro, S. L. Kim, H. S. Kim, and I. M. Chung. 2012. Analysis of isoflavone, phenolic, soyasapogenol, and tocopherol compounds in soybean [Glycine max L. Merill] germplasms of different seed weights and origins. J. Agric. Food Chem. 60 : 6045-6055.
10.1021/jf300463f22577842
14
Kim, E. M., K. J. Lee, and K. M. Chee. 2004a. Comparison in isoflavone contents between soybean and soybean sprout of various soybean cultivars. Korean J. Nutr. 37 : 45-51.
15
Kim, J. K., E. H. Kim, O. K. Lee, S. Y. Park, B. Lee, S. H. Kim, I. M. Park, and I. M. Chung. 2013. Variation and correlation analysis of phenolic compounds in mungbean (Vigna radiate L.) varieties. Food Chem. 141 : 2988-2997.
10.1016/j.foodchem.2013.05.06023871050
16
Kim, J. S., J. G. Kim, and W. J. Kim. 2004b. Changes in isoflavones and oligosaccharides of soybeans during germination. Korean J. Food Sci. Technol. 36 : 294-298.
17
Kim, J. A. and I. M. Chung. 2007. Change in isoflavone concentration of soybean (Glycine max L.) seeds ar different growth stage. J. Agric. Food Chem. 87 : 496-503.
10.1002/jsfa.2743
18
Kim, Y. H., Y. H. Hwang. and H. S. Lee. 2003. Analysis of isoflavones for 66 varieties of sprout beans and bean sprouts. Korean J. Food Sci. Technol.35: 568-575.
19
Lee, S. J., J. K. Ahn, T. D. Khanh, S. C. Chun, S. L. Kim, H. M. Ro, H. K. Song, and I. M. Chung. 2007. Comparison of isoflavone concentrations in soybean (Glycine max (L.) Merrill) sprouts grown under two different light conditions. J. Agric. Food Chem. 55 : 9415-9421.
10.1021/jf071861v17941689
20
Lee, S. J., P. Seguin, J. J. Kim, H. I. Moon, H. M. Ro, E. H. Kim, S. H. Seo, E. Y. Kang, J. K. Ahn, and I. M. Chung. 2010. Isoflavones in Korean soybeans differing in seed coat and cotyledon color. J. Food Compost. Anal. 23 : 160-165.
10.1016/j.jfca.2009.08.005
21
Messina, M. J., V. Persky, K. D. R. Setchell, and S. Barnes. 1994. Soy intake and cancer risk: a review of the in-vitro and in-vivo data. Nutr. Cancer 21 : 113-131.
10.1080/016355894095143108058523
22
Omoni, A. O. and R. E. Aluko. 2005. Soybean foods and their benefits potential mechanisms of action. Nutr. Rev. 63 : 272-283.
10.1111/j.1753-4887.2005.tb00141.x16190314
23
Park, S. Y., S. H. Lim, S. H. Ha, Y. Yeo, W. T. Park, D. Y. Kwon, S. U. Park, and J. K. Kim. 2013. Metabolite profiling approach reveals the interface of primary and secondary metabolism in colored cauliflowers (Brassica oleracea L. ssp. botrytis). J. Agric. Food Chem. 61 : 6999-7007.
10.1021/jf401330e23782237
24
Phommalth, S., Y. S. Jeong, Y. H. Kim, and Y. H. Hwang. 2008. Isoflavone composition within each structural part of soybean seeds and sprouts. J. Crop Sci. Biotechnol. 11 : 57-62.
25
Sarkar, F. H. and Y. Li. 2003. Soy isoflavones and cancer prevention. Cancer Investig. 21 : 744-757.
10.1081/CNV-12002377314628433
26
Setchell, K. D. R. and S. J. Cole. 2003. Variation in isoflavone levels in soy foods and soy protein isolates and issues related to isoflavone databases and food labeling. J. Agric. Food Chem. 14 : 4146-4155.
10.1021/jf026199b12822960
27
Wang, H. J. and P. A. Murphy, 1994. Isoflavone content in commercial soybean foods. J. Agric. Food Chem. 42 : 1666- 1673.
10.1021/jf00044a016
28
Yu, O., J. Shi, A. O. Hession, C. A. Maxwell, B. McGonigle, and J. T. Odell. 2003. Metabolic engineering to increase isoflavone biosynthesis in soybean seed. Phytochemistry 63 : 753-763.
10.1016/S0031-9422(03)00345-5
페이지 상단으로 이동하기