Introduction
MATERIALS AND METHODS
Plant Material and Field Investigation
Chemical Analysis
Data Analysis
RESULTS AND DISCUSSIONS
Variation of Yield and Yield Components
Variation of Seed Quality
Estimation of Optimum Harvest Time
Introduction
Well-matured peanut seed contains rich unsaturated fatty acids like oleic acid, tocopherols, and fat-soluble vitamins, as well as antioxidant sources from the seed coat (Park & Park, 2002). Most of the cultivated peanut, as defined to have an indefinite inflorescence habit, flowering and fertilization generally last until the harvest, therefore the maturity of the pod is highly variable (Pae & Kim, 1997). To determine the optimal harvesting time, the creation of sufficient wrinkles on the pod surface and the color change of mesocarp are recommended to be checked (Canavar & Kaynak, 2013; Gulluoglu et al., 2016; Pattee et al., 1980). The optimum harvest time for Runner-type variety, ‘Florunner’, which demonstrated the highest yield, was 146 to 153 days after planting (Sanders et al., 1980), and 153 days after sowing for Virginia-type variety, ‘NC-7’ (Canavar & Kaynak, 2013). On the cultivation under moderate fertilization, it usually takes 60 to 80 days to be fully-mature after pollination (Stalker & Wilson, 2016). Park and Oh (1992) reported that between 100 to 110 days after the flowering date, peanut showed the highest yield of seed. The yield-related components like average pod numbers, 100-seed-weight were varied by harvesting time (Lee et al., 1999). Similar to the yield, seed component, as well as sensory attributes of peanut seed, was also affected by the harvest time (Oupadissakoon et al., 1980; Sanders & Bett, 2010).
The seed coat of peanut is generally composed of 20% of fat, 19% of protein, 18% of fiber, and 2% of ash (Constanza et al., 2012). The color of the seed coat peanut is varied by genetic resources (Branch, 2011). Virginia-type peanut cultivar, ‘Heuksaeng’, with the dark-purple testa was reported to have sprouting and discoloration characteristics under the delayed harvest (Pae et al., 2017), which could result in the deterioration of seed quality. The purple pigment of peanut was mainly composed of two water-soluble cyanidin compounds, Cyanidin-3-O-sophoroside and cyanidin-3-O-sambubioside (Attree et al., 2015; Cheng et al., 2009; Zhao et al., 2017). In soybean, the expression of the black color of seed coat is primarily determined by the inheritance, but also quantitatively affected by the environment and cultivation like harvest time (Joo et al., 2004). Yi et al. (2008) reported that the total amount of pigment in seed coat was gradually increased with the delayed harvesting time in soybean. Taking the importance of seed quality among the purple-seed coat peanut market, the study about seed quality affected by the cultivation is still limited. The objective of this study is the investigation of the effect by different harvest time, and we examined the yield components and seed properties of purple seed coat peanut which is to be expected to provide useful information for high-quality peanut production.
MATERIALS AND METHODS
Plant Material and Field Investigation
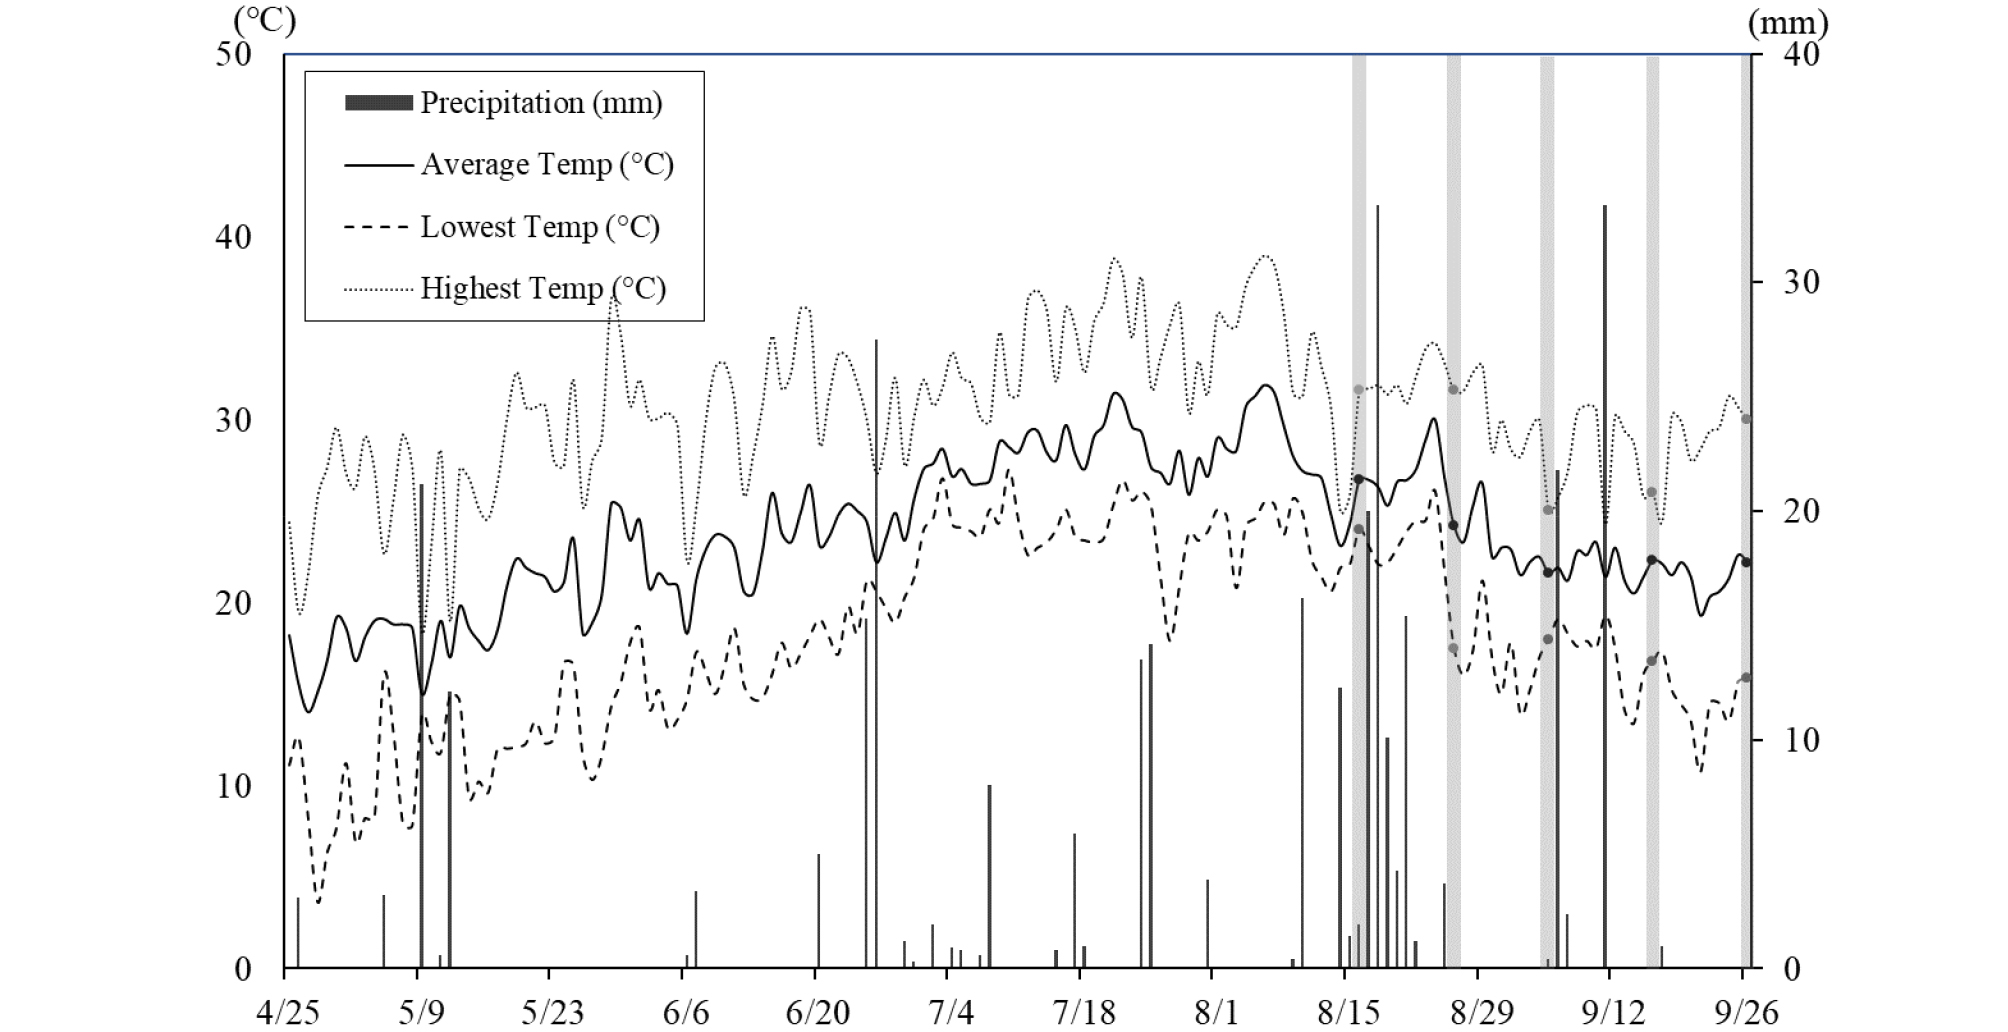
The study was conducted in the experimental field of National Institute of Crop Science, Miryang, Korea (35°29'36.8"N 128°44'30.3"E) in 2018. We used the dark purple seed coat variety ‘Heuksaeng’ for the experiment, originated from the breeder’s seed. The entire field was fertilized with 30-100-100 kg of N-P2O5-K2O during plowing. Throughout crop cycle, irrigation was sufficiently provided to keep up the optimal growing condition. For the cultivation, we used the 0.01 mm-thick polyethylene vinyl for mulching and planted with the distance of 25 cm per plant and 55 cm per row. Peanuts were sown in single seed per hole. Peanut seeds were sown on 25th April and the treatment of harvesting time was divided by the accumulated days after flowering (DAF), from 70 to 110 days by the interval of ten. The experimental plot was designed for the randomized block of three replications. From each replicate, 10 peanut plants were investigated and harvested.
The length of the main stem, number of mature pods per plant, the ration of the mature pods, the number of seeds per pod, the ratio of seed and pod weight (shelling ratio), and 100-seed weight were examined. The seed moisture during drying was obtained using halogen moisture analyzer (MA160, Sartorius). When seed moisture reached to 6% of seed weight, pods were manually shelled. The seed quality was divided into three: high - fully mature and none of the discoloration of seed, medium - mature and partly discolorated seed, low - a distinct discoloration and sprout, non-matured seed. It is defined as the market seed with the sum of high and medium qualities. For the assessment of seed size, the length of seed was measured from radicle to the tip of the cotyledon, and the width for the between of two cotyledons by using calipers.
Chemical Analysis
Dried and shelled peanut seeds were measured for Lab color space (CM-3700D, Minolta) by a single seed. The pigment was collected from the extraction of seed coat in 20% of methanol (1% hydrochloric acid) and analyzed using HPLC (Ultimate 3000, Thermo Scientific) and reversed-phase column (Hypersil GOLD 4.6×150 mm, 5 μm, Thermo Scientific). For the mobile phase H2O (with 0.1% trifluoroacetic acid for A) and methanol (with 0.1% trifluoroacetic acid for B) was used with the gradient of solvent B as follows: 0 min of 8%. 2min of 8%, 5min of 15%, 7min of 15%, 10min of 20, 13min of 20%, 30min of 35%, 33min of 50%, 35min of 50%, 37min of 8%, and 45min of 8% with the flow rate of 0.8mL per minute, and the absorbance was detected at 530nm. The quantification was performed using the standard-grade Cyanidin-3-O- sophoroside and cyanidin-3-O-sambubioside (Supelco Inc.). To access the antioxidant activity of seed coat, seeds were blanched and the seed coat removed from the kernel was extracted in 80% ethanol. 2,2′-azino-bis-3-ethylbenzthiazoline- 6-sulphonic acid (ABTS) and 1,1-diphenyl-2-picrylhydrazyl (DPPH) free radical scavenging activity were measured onto 6-hydroxy-2,5,7,8-tetramethylchroman-2-carboxylic acid (Trolox) equivalent per 100g of seed coat, the absorbance of the sample was detected at 735 nm and 520 nm, respectively (SpectraMAX384, Molecular Devices LLC). With the homogenized seed sample, the crude protein (Rapid N Cube, Elementar) and crude fat content were examined (E-816SOX, Buchi), and the fatty acid composition was obtained from the gas chromatography flame ionization detector (A7890, Agilent) by the method of Lee et al. (2016).
Data Analysis
Analysis of Variance (ANOVA) was used and all of the data from the chemical analysis and the measurement from the field investigation were compared using the Least Significant Difference (LSD) at P<0.05. All statistical analysis was conducted by using SAS ver. 9.4 (SAS Institute, 2012).
RESULTS AND DISCUSSIONS
Variation of Yield and Yield Components
The agricultural properties and yield components were varied by the different harvest time in the study (Table 1). The length of the main stem was significantly high on the plants from 100 and 110 DAF, the number of mature pods per plant was highest on 80 DAF, followed by 90 and 110 DAF. Likewise, the ratio of the mature pod was higher on 80 DAF and showed a relatively lower number on 110 and 70 DAF. These resulted from the increased number of underground sprouting seeds which was depicted from the study of Pae et al. (2017), and the pods that began to fall off from the plants after the maturity stage (Sanders & Bett, 2010). The number of seeds per 100 pods was highest on 90 DAF indicating 151.5 seeds, and lowest on 110 DAF of 84.9 seeds. The shelling ratio was highest on 90 DAF. The average weight of 100 seeds was significantly higher on 100 DAF, followed by 110, 90, 80 DAF. The ratio of market seed with the distinct dark-purple seed coat and fully mature shape was higher when the earlier the harvest time was. The proportion market seed on 110 DAF was 53.2% which is 42%p lower than the seeds from 70 DAF. The average pod yield was highest on 80 DAF, and seed yield was also significantly higher on 80 DAF likewise.
Table 1.
Variation in major yield components of 'Heuksaeng' peanuts under different harvest times.
Obtained seed yields of 80 and 90 DAF were 29% and 27% higher than 70 DAF, respectively. Similarly, the numbers of pods per plant were 29%, 17% higher and 100-seed weight showed 11% and 16% increase compared to 70 DAF, respectively. Among the harvest time, 100 DAF indicated the higher number in 100-seed weight which demonstrated 22% of increase compared to 70 DAF, however, the market seed ratio was low about 12% due to the underground sprout and discoloration, which caused the sharp decline of the seed yield.
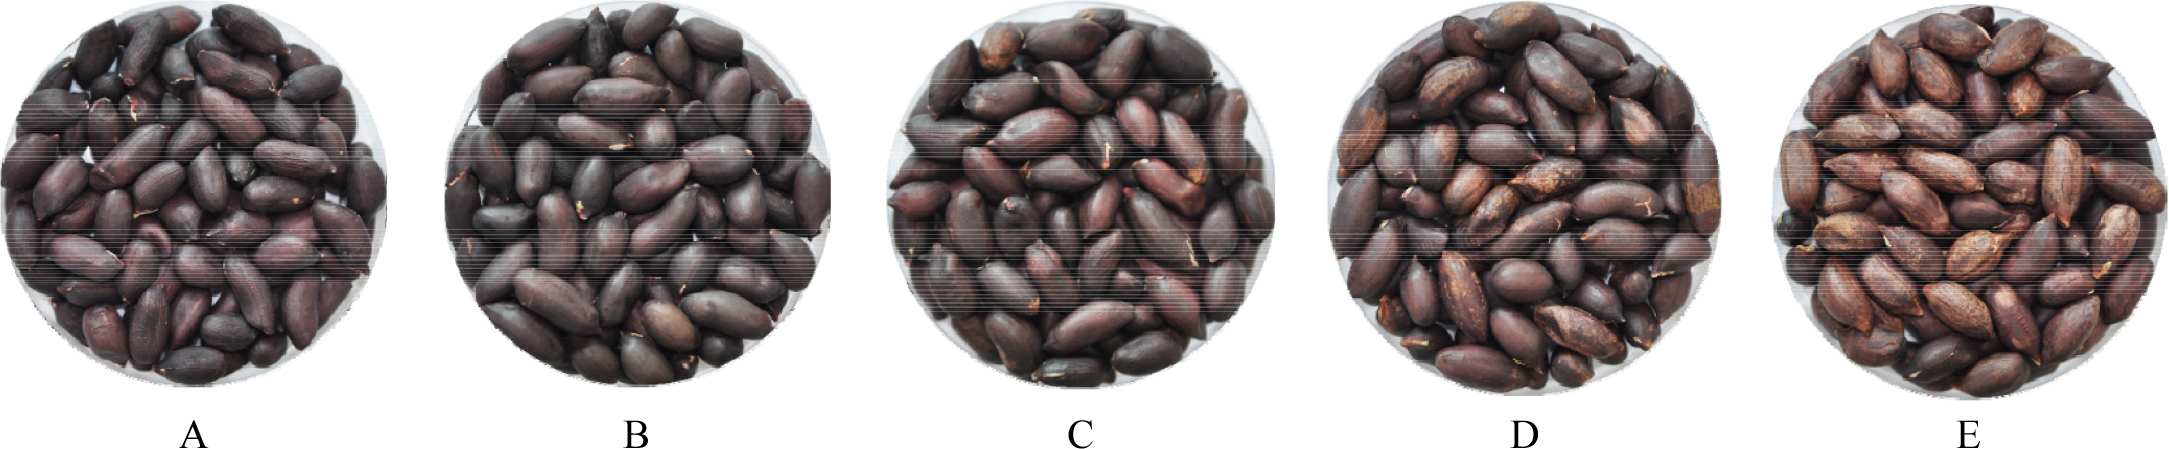
Variation of Seed Quality
The decrease of high-quality proportion was shown with the delayed harvest time, which was 15.1% on 110 DAF. On the contrary, medium- and low-quality proportion was gradually increased after 70 DAF, the low-quality seed ratio of 110 DAF was ten-fold higher than 70 DAF. Seed length and width peaked from the seed of 90 DAF and did not show any significant difference after 90 DAF. Among the Lab color of the seed coat, the lightness (L) was gradually increased with the increase of DAF due to the decomposition of seed coat pigment, a and b values were also significantly increased with the delayed harvest time (Table 2, Fig. 1).
Table 2.
Changes in seed properties of 'Heuksaeng' peanuts under different harvest times.
The crude fat contents were highest on 70 DAF and increased after 100 DAF, and the fatty acid composition did not show any significant difference by the harvest time (data not shown). The crude protein of seed reached a maximum of 29.01% on 80 DAF, and a minimum of 27.09% of 100 DAF. The quantification of cyanidin compounds from the seed coat extracts, both cyanidin-3-O-sophoroside and cyanidin-3-O- sambubioside indicated the gradual decrease with the delayed harvest time. From the 110 DAF extract, both of the major anthocyanins were found less than 4% of the extract of 70 DAF showing perceivably distinct discoloration. The antioxidant activities represented by the free radical scavenging methods, the extract from 100 DAF seeds showed the highest DPPH and ABTS, followed by 80 and 70 DAF. From the extract of 110 DAF, the lowest scavenging activities were measured 69% and 83% of the maximum, respectively (Table 3).
Table 3.
Variation in seed content, anthocyanins, and antioxidative activities under different harvest times in 'Heuksaeng' peanuts.
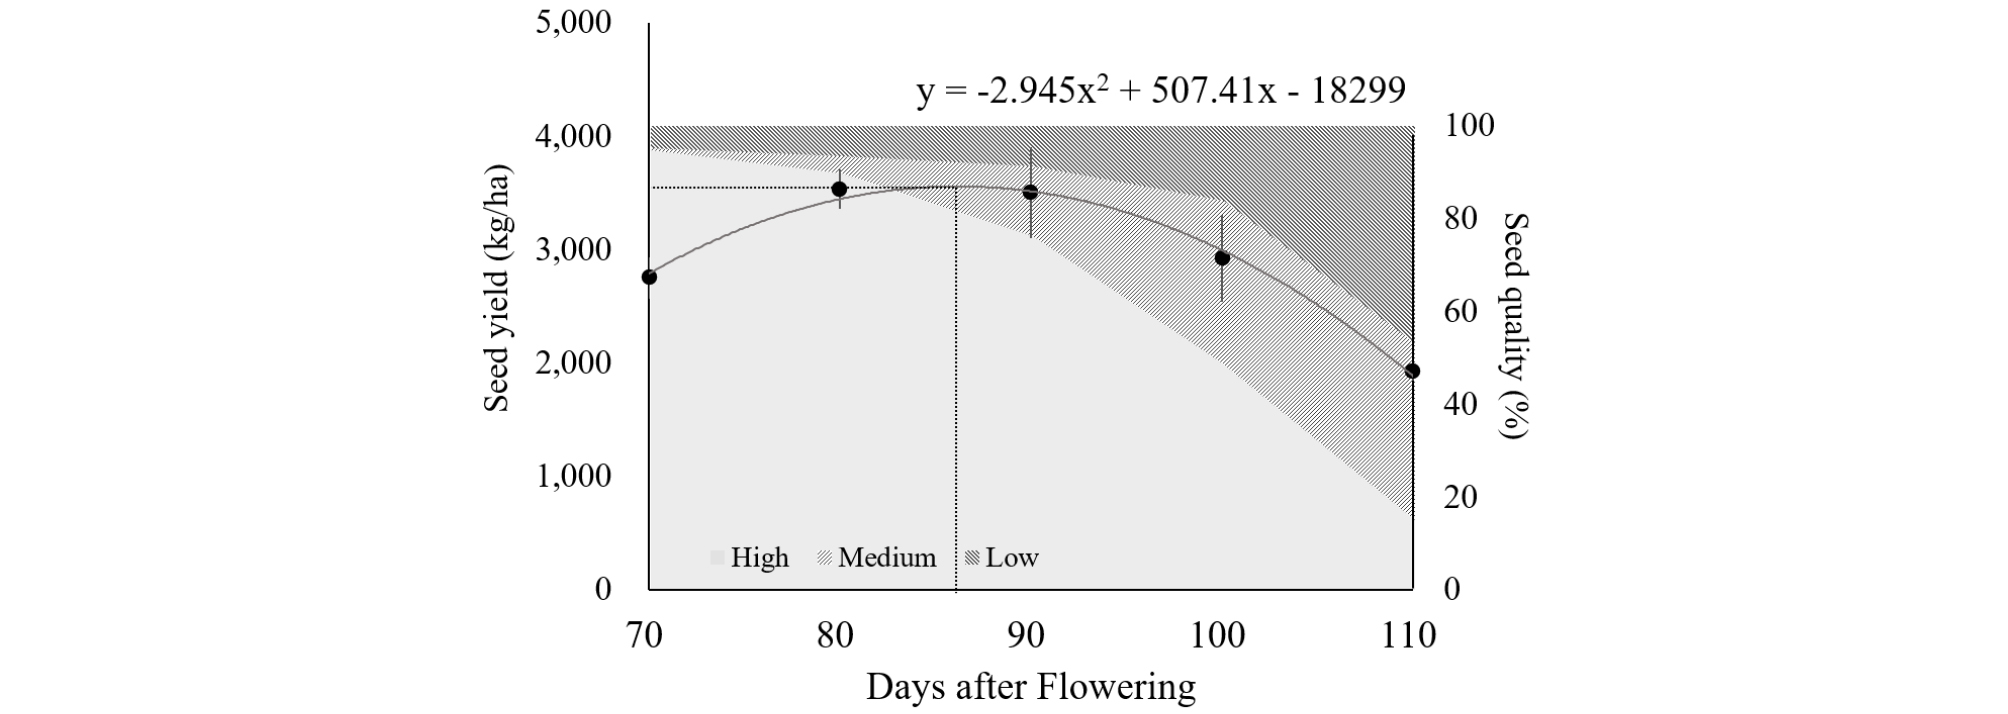
Estimation of Optimum Harvest Time
From the results of yield components and seed qualities, we could estimate the optimum harvest time (Fig. 2), which is demonstrated by the equation [Estimated yield = -2.945× (DAF)2+507.41×(DAF)-18299]. It is ascertained that harvesting around 85 days after flowering could induce the higher productivity and seed qualities of ‘Heuksaeng’. From these results, ‘Heuksaeng’ is recommended to do harvest about 10 to 15 days before average Virginia-type cultivar, which is expected to show their best yield while minimizing the deterioration of seed quality.