

Introduction
MATERIALS AND METHODS
Test Site and Plant Materials
Unmanned Aerial Vehicle Flight and Image Acquisition
Image Processing
RESULTS AND DISCUSSION
Introduction
Weed control is one of the most important practice not only for organic farming but also for modern agriculture. According to Oerke (2006), the potential crop yield losses are caused by weed worldwide. In general, the spatial distribution of weeds is a heterogeneous forming patch which varies in size, shape, and density (Cardina et al., 1997; Jurado-Expósito et al., 2003; Rew et al., 1996). However, such variation within fields has mainly been neglected owing to technical limitations to detect those patches. As consequences, unnecessarily large volume of herbicides has been applied to fields (Christensen et al., 1998). This causes two major problems, polluted environments and higher management costs due to chemical and labor because most weeds are controlled by chemically (Christensen et al., 2009). These issues led many researchers to study site-specific weed management (SSWM) (Brown & Noble, 2005; Johnson et al., 1997; López-Granados, 2011; Swinton, 2005; Tian et al., 1999; Torres-Sánchez et al., 2013).
To detect weed patches in the field, remote sensing technologies were incorporated (Thorp & Tian, 2004). Methods for weed patch detection could fall largely into two categories. One is by image segmentation based on morphology (Gerhards & Oebel, 2006; Pérez-Ortiz et al., 2015; Ribeiro et al., 2005) and the other is by vegetative indices based on light wavelength (Alexandridis et al., 2007; Gerhards et al., 2002; Goel et al., 2002). Between those, the latter is easier to operate because it does not need a sophisticated algorithm for deciding weeds from crop and soil as the formal one. Thus, the objective of the current study is to determine if NDVI obtained from the data by the low-resolution camera mounted on the unmanned aerial vehicle (UAV) could discriminate weed patch from the buckwheat field. If it could so, it will be useful for farmers to control weeds with less chemicals in a more precise manner. Furthermore, it would be very much helpful for stepping closer to sustainable agriculture with less chemical pollution in the environments.
MATERIALS AND METHODS
Test Site and Plant Materials
A field experiment was conducted in buckwheat field, located in Seogwipo-si, Jeju, Republic of Korea during the 2018 growing season. Buckwheat seeds of the cultivar “Dasan” were scattered to be sown (120 kg ha-1) on August 27th, 2018. Prior to sowing, twice of tillage were executed to prepare the field on August 14th and 21st 2018. Fertilizer (300 kg ha-1) was applied on August 21st, 2018.
Unmanned Aerial Vehicle Flight and Image Acquisition
Images were taken on October 14th,2018 using a manufactured DJI F550 hexa-rotor. Details of the unmanned aerial vehicle (UAV) platform specifications are described in Table 1. The UAV fly over automatically the experimental field using a flight controller (Pixhawk, 3DR, USA), a global positioning system (GPS), and inertial measurement unit (IMU). An open source autopilot software (Mission Planner, ArduPilot, USA) was used to monitor autonomous flight paths and flight status in UAVs. The flight path was designed to ensure the overlapping ratio of at least 85% forward overlap and 70% side overlap, which is necessary to identify enough key points for image orthomosaic(?). A 2.4 GHz wireless remote controller was used for manual takeoff and landing.
Table 1. Specifications of developed unmanned aerial vehicle (UAV) platform.
A multi-spectral camera (Sequoia, Parrot, France) was used to collect images of buckwheat (Fig. 1(a)). Four separate images of green, red, red edge and near infrared (NIR) bands could be acquired using the multi-spectral camera. Spectral responses of four bands are shown in Fig. 1(b). Details of the camera technical specifications are described in Table 2. Radiometric calibration was conducted based on UAV-mounted sunshine sensor for obtaining a precise image even under changing light conditions.
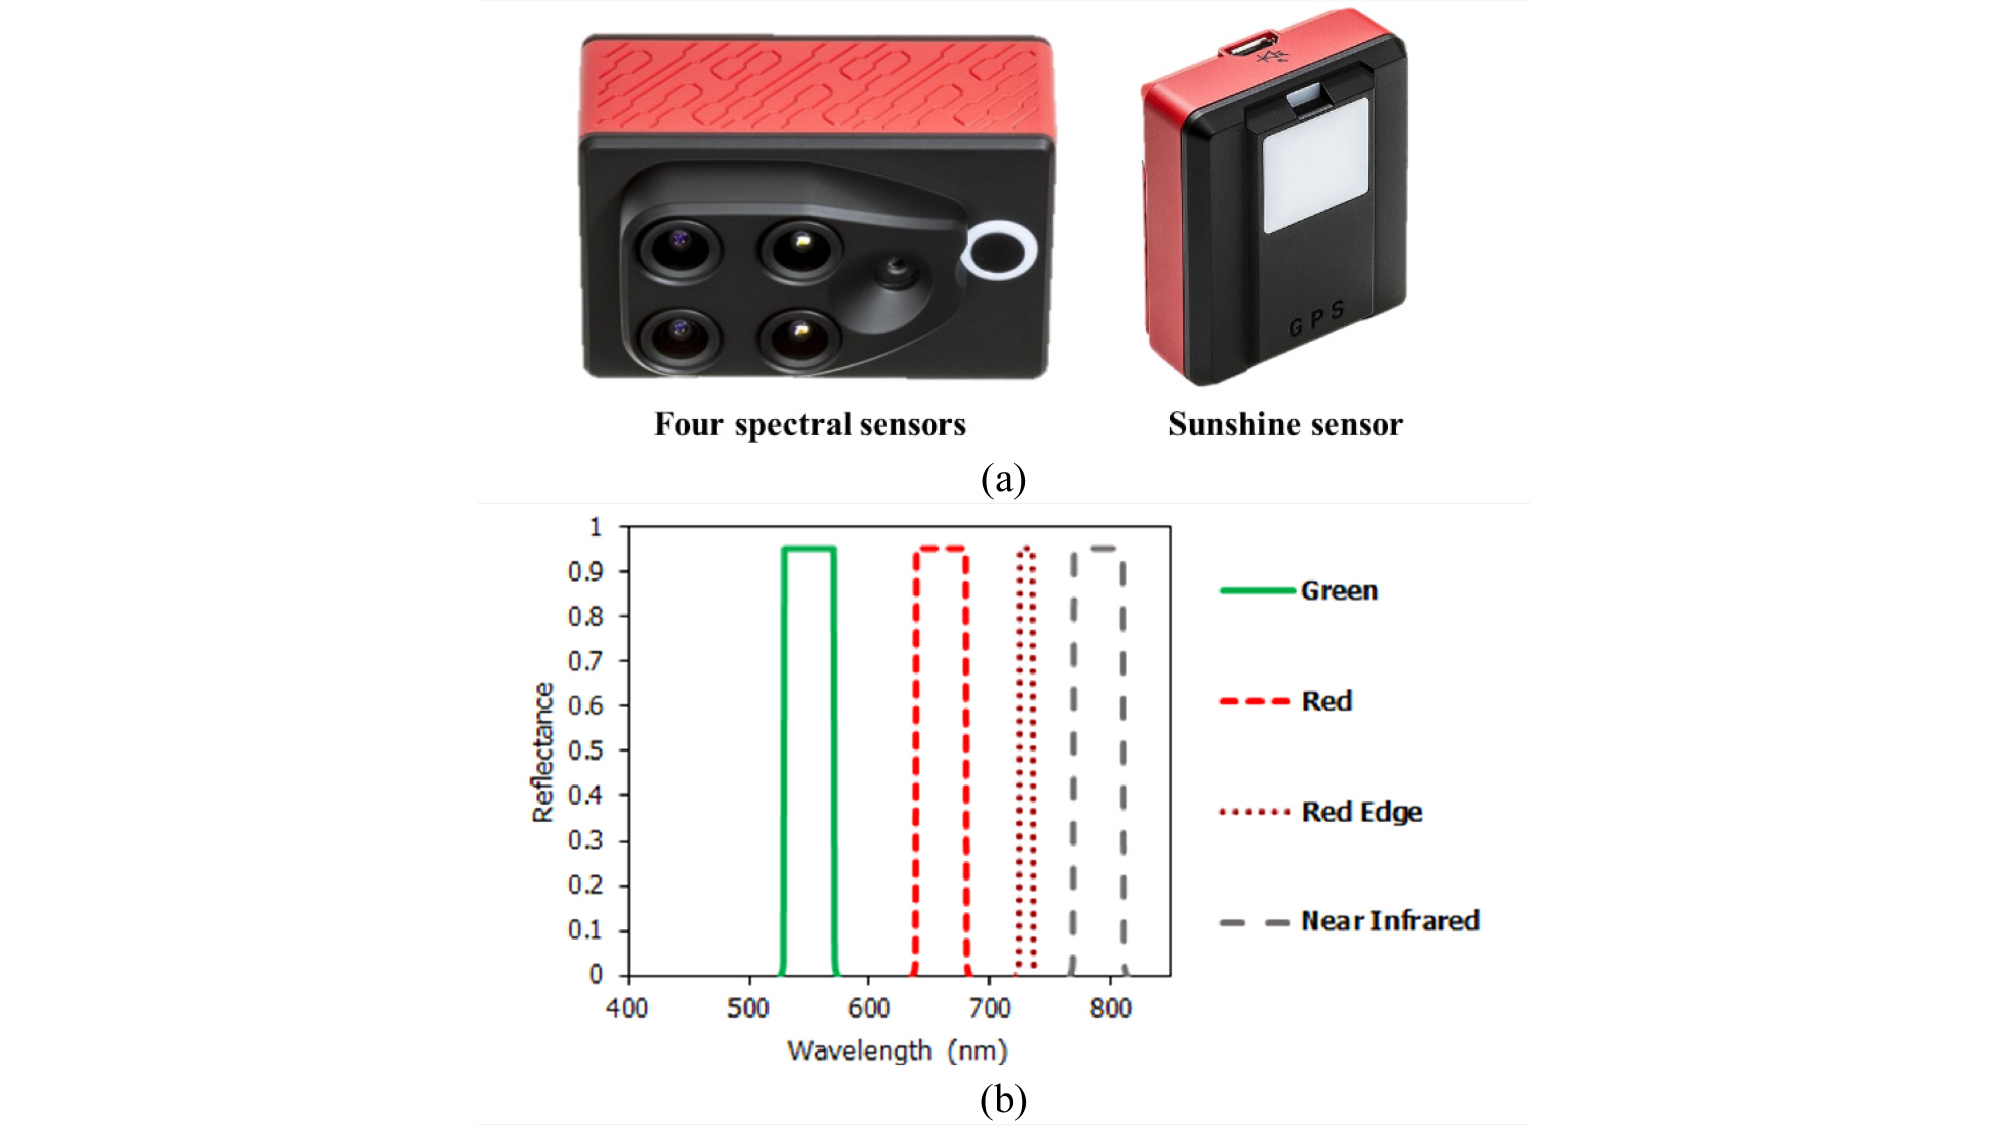
Table 2. Technical specifications of multi-spectral camera.
The details of the experimental flight are shown in Table 3. The images were acquired based on a time-lapse function of the multi-spectral camera that took one image every one and a half seconds for ensuring at least 85% forward overlapping ratio.
Table 3. Experimental unmanned aerial vehicle (UAV) flight details.
| Flight date | The number of images |
Flight altitude (m) |
Flight speed (m s-1) |
Ground resolution (cm pixel-1) | Illumination |
Wind (m s-1) |
| Oct. 13, 2018 | 1,220 | 80 | 2 | 8.12 | Clear | 1.5 |
Image Processing
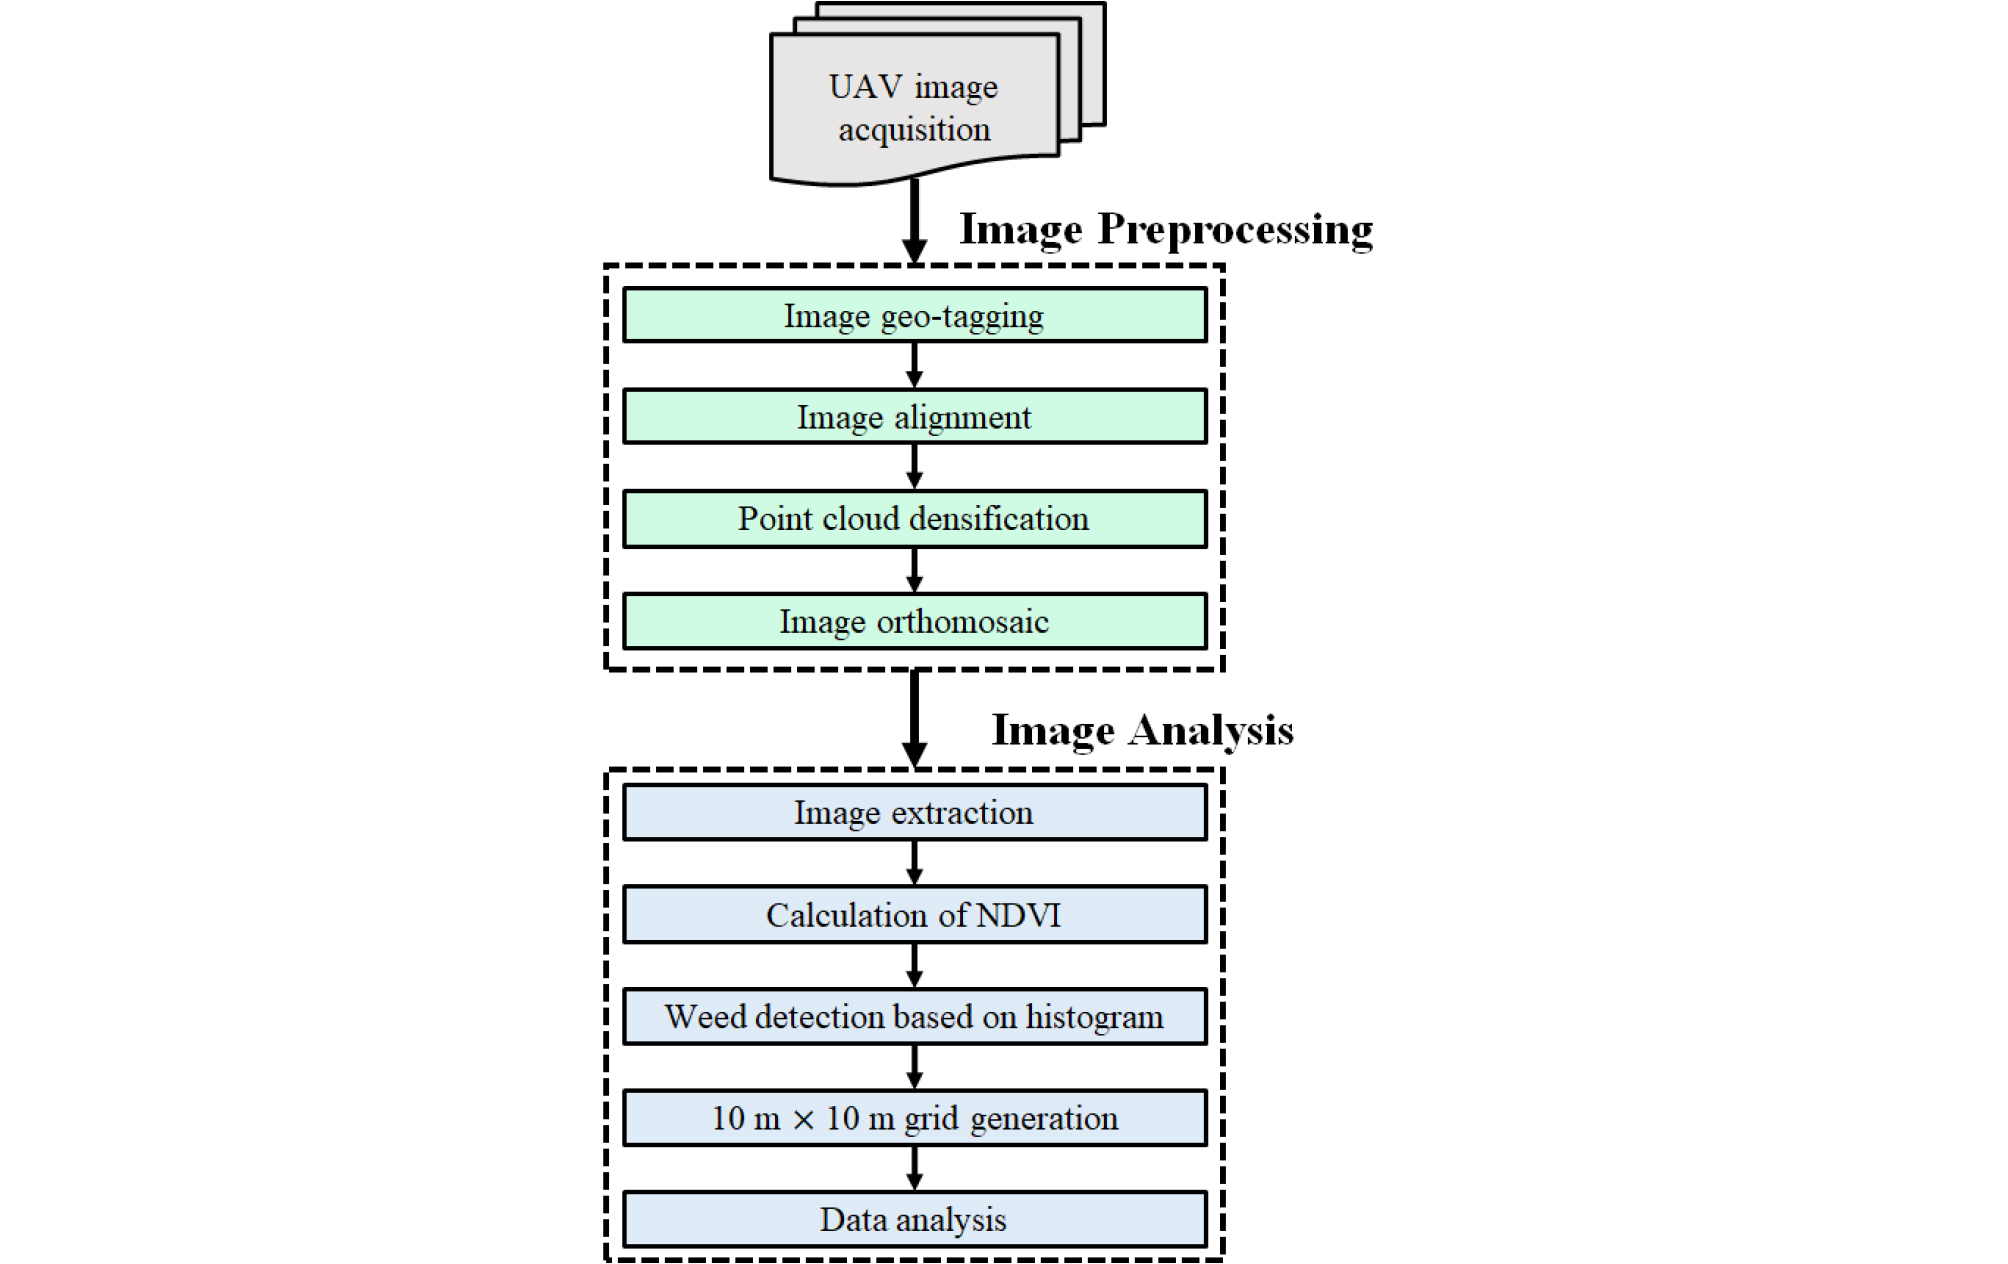
The flow chart of the image preprocessing and analysis steps, including image orthomosaic, calculation of NDVI and weed detection, is shown in Fig. 2. The Pix4Dmapper Pro 3.0.17 (Pix4D SA, Lausanne, Switzerland) was used for orthomosaic of the collected UAV images. Image preprocessing was conducted in the same way as previously described (Kim et al., 2018). As results of image preprocessing, orthomosaic generation procedure was conducted with the image exported in GeoTIFF data format (*.tif). After image preprocessing, image extraction for data analysis was conducted using Esri ArcGIS 10.1 software (ArcGIS, Redlands, CA, USA). Normalized difference vegetation index (NDVI) based on NIR channel was tested for weed detection in buckwheat field. NDVI is the most popular vegetation index widely been used for crop monitoring applications in precision agriculture. NDVI was calculated like following Equation 1 (Rouse 1974):
| $$\begin{array}{l}\mathrm{NDVI}=\frac{R_{790}-R_{660}}{R_{790}+R_{660}}\\\end{array}$$ | (1) |
where, R790 = reflectance values (%) of NIR channel (770-810 nm); R660 = reflectance values (%) of red channel (640-680 nm). NDVI could be calculated and NDVI maps could be generated using raster calculator function in the ArcGIS software.
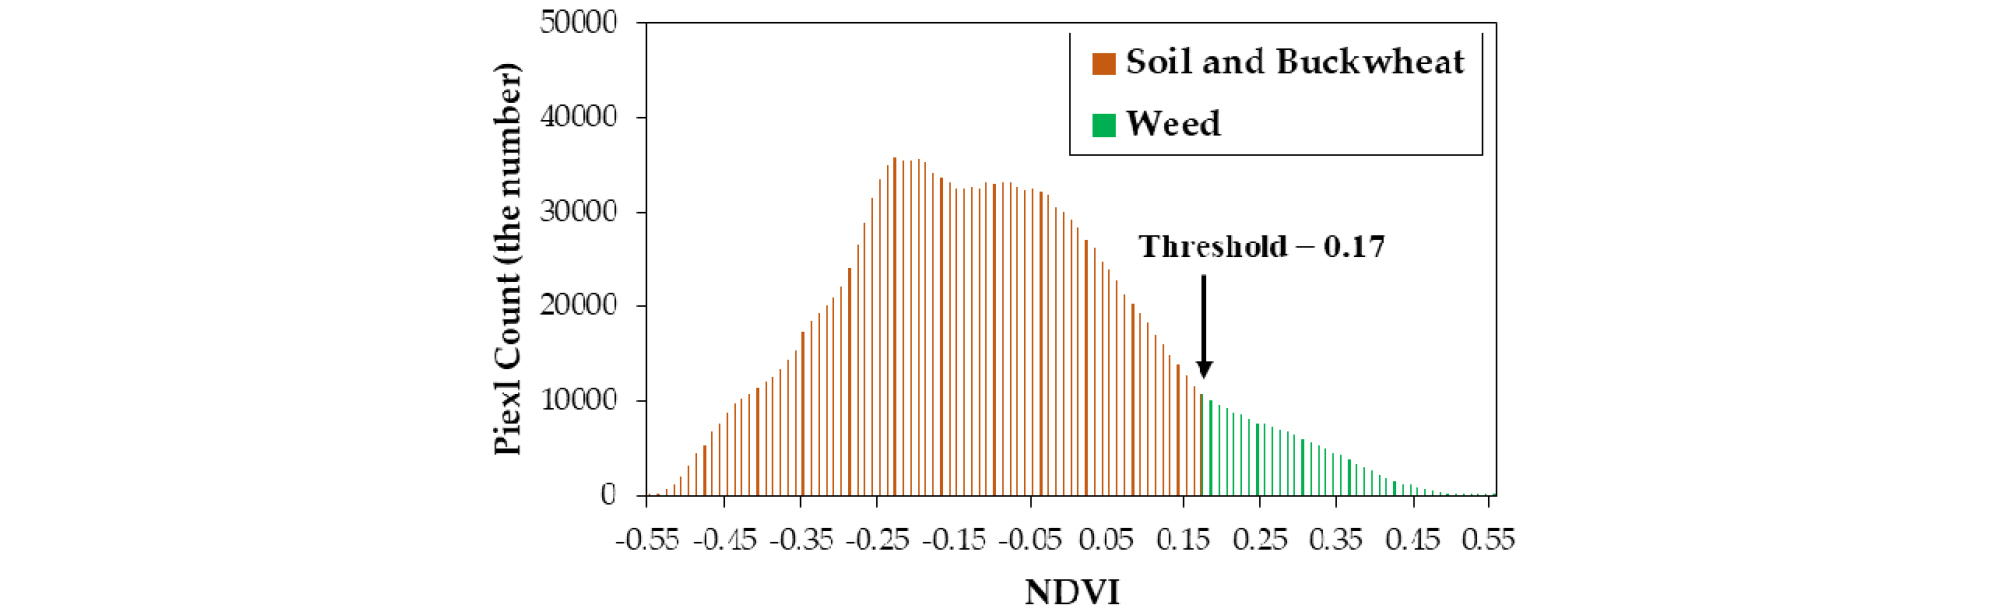
Weed detection, a process for extracting only weeds from buckwheat and soil in UAV images, is an important step. As widely known, the higher NDVI value is, the greener crop is. In this study, the experimental crop, buckwheat, produces white flowers. Weed is greener than the white flower of buckwheat in UAV-based top-view images. Therefore, NDVI values of weed are higher than those of buckwheat in UAV images. As shown in Fig. 3, on histogram analysis of UAV-based multi-spectral images in terms of NDVI, it was possible to effectively separate the images of weeds from the background using threshold value.
After weed segmentation, 10 m by 10 m grids were generated in the whole field for a detailed data analysis. Each grid was used to detect weed patch as a basic unit of regions of interest (ROIs). The weed patch detection in each grid was used to control weeds with less chemicals in a more precise manner.
RESULTS AND DISCUSSION
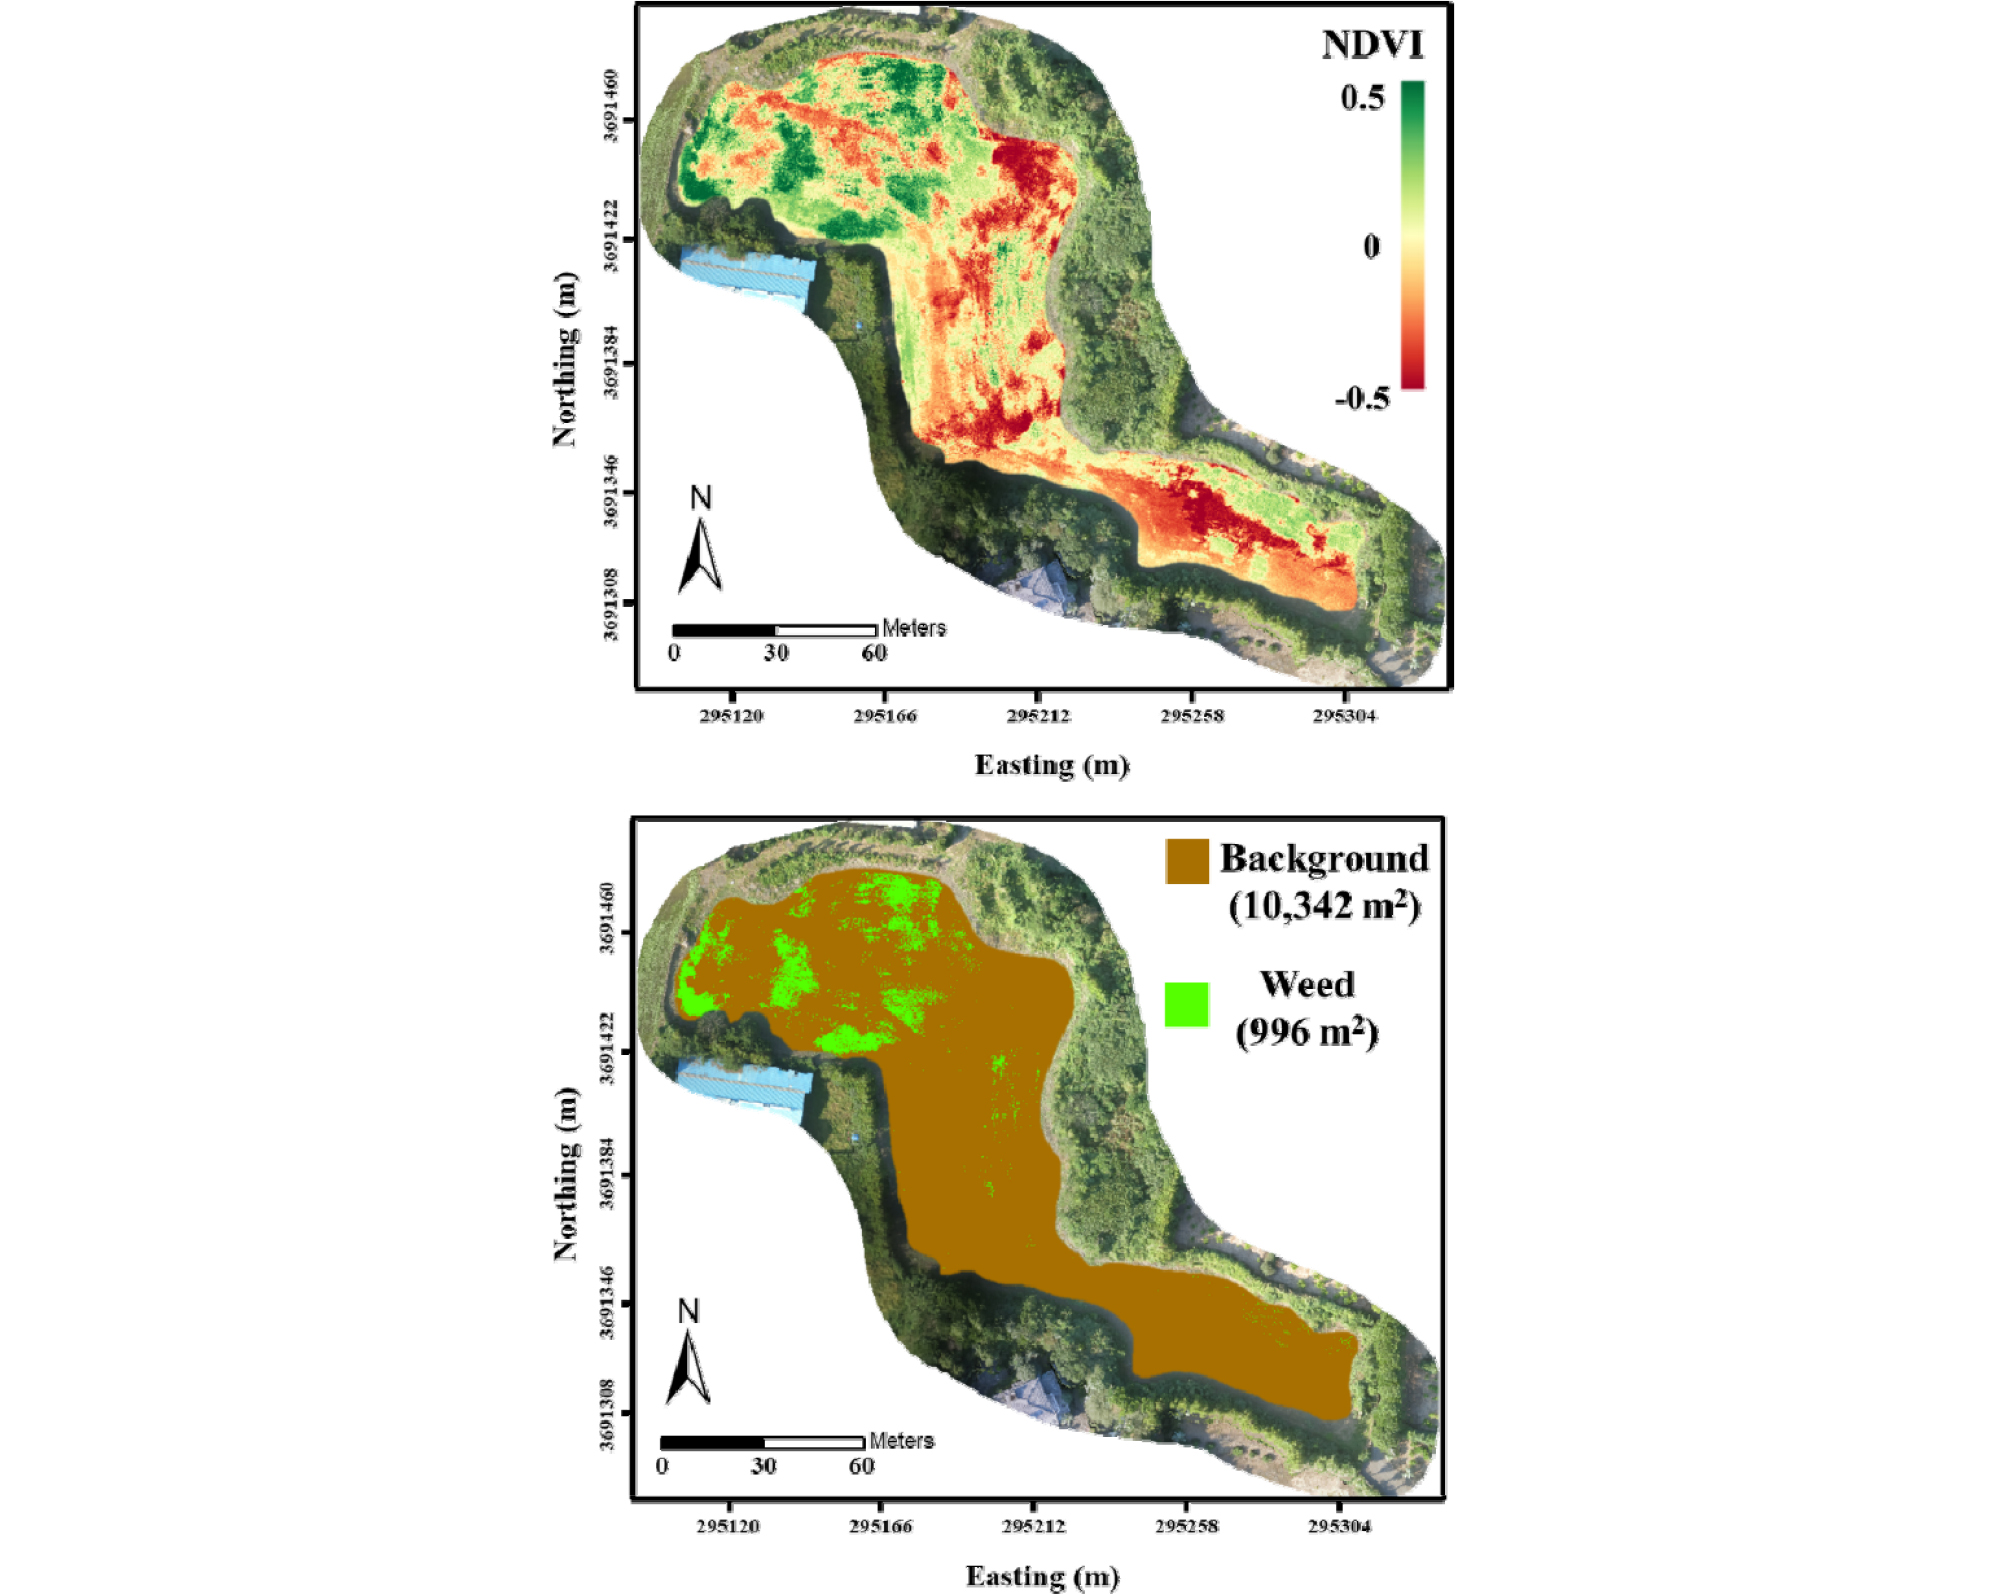
The whole field was mapped using NDVI based on the obtained data using a multi-spectral camera mounted on the UAV (Fig. 3 (upper)). The NDVI threshold of 0.17 was used in order to discriminate weeds out of buckwheat based on the inflection point of the histogram (Fig. 4) because it could indicate different leaf structure from different kind of plant. Weed fields were extracted from the whole field using the NDVI threshold so that the weed map is constructed as shown in Fig. 3 (lower). In Fig. 3 (lower), out of total field area (11,338 m2), weeded area was 8.8 percent (996 m2).
In order to suggest precise weeding method for minimizing chemicals, 10 m by 10 m grids map were generated in the whole field as shown in Fig. 5. When the field was divided by 10 m by 10 m grids, the number of total grids including the buckwheat test plot was 160 (Table 4). Among them, the number of those grids imbedding weeds was 111. The large patches where the weeds in the grid are over 20 percent could be pointed out in the map of which number was 25 grids. The percentage of weeds area within one grid can be adjusted otherwise as a necessity. As a result, the grids required weeding are 25 out of 160, which is 15% of the whole grids. Therefore, it is demonstrated that weed patches could be detected and targeted according to their size. With this method, it is possible to save a lot of chemicals by using only in the designated grids including the large weed patches (25 grids), instead of using chemicals in the whole map.
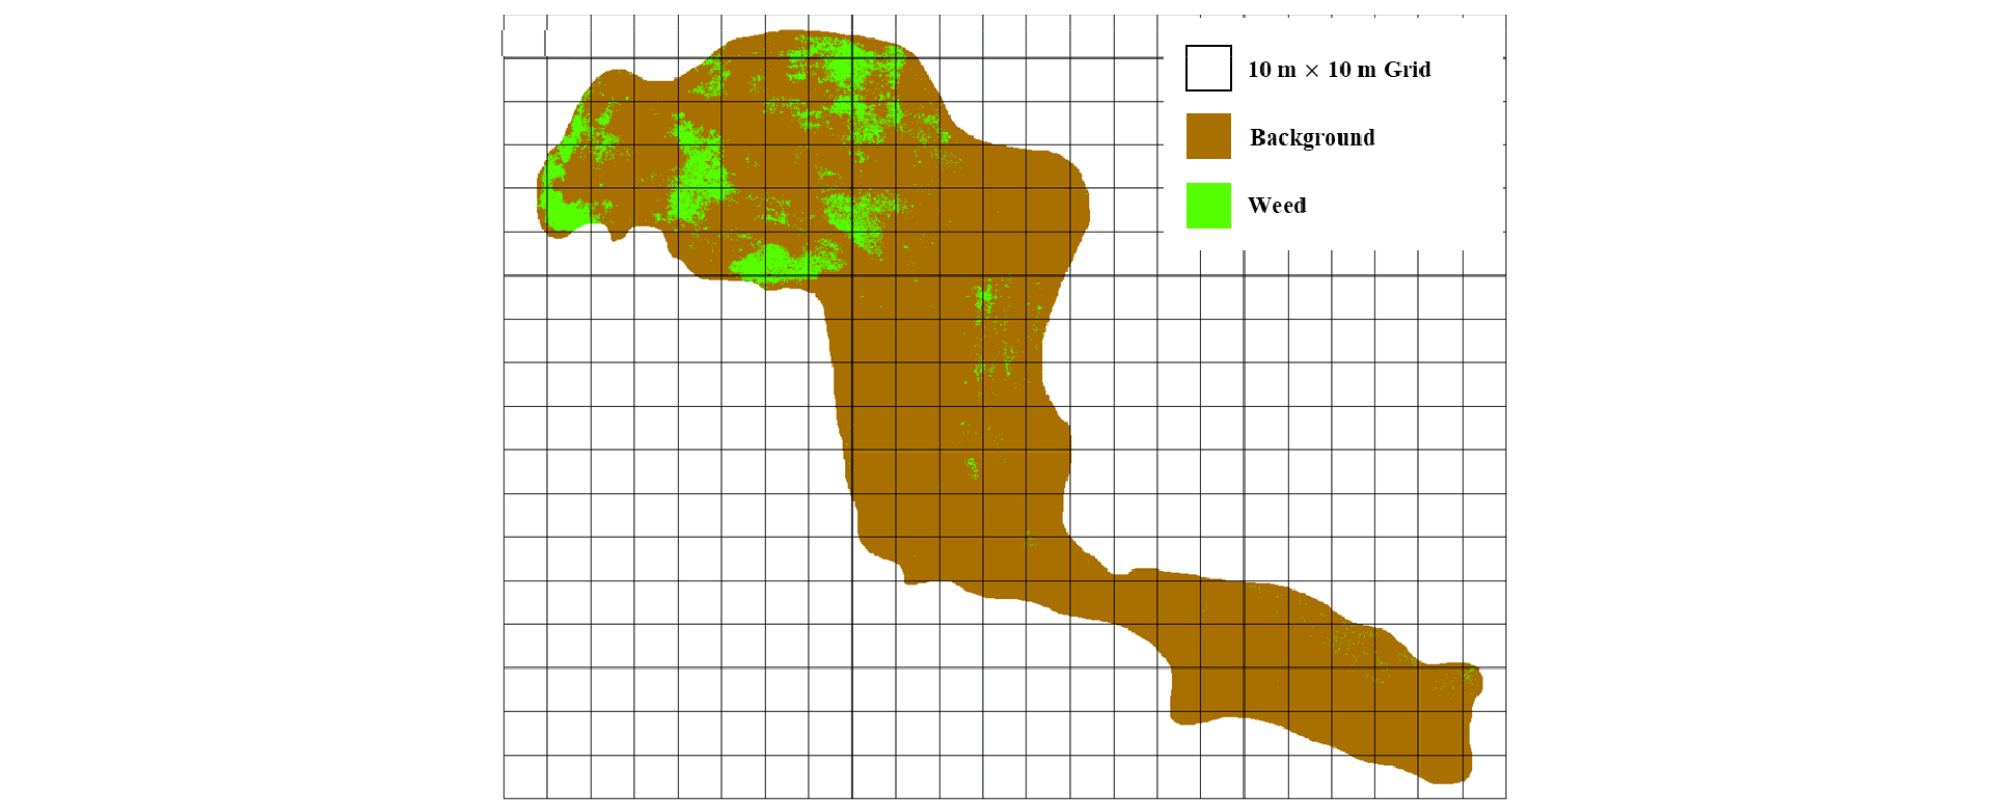
Table 4. Number of grids extracted from the generated grid map.
| Items | The number of grids |
| Grid of whole test site | 160 |
| Grid including weeds | 111 |
| Grid including weeds area over 20% | 25 |
As stated above, this is not the first study for weed detection in the field using UAV nor using NIR camera. Nevertheless, this study has its unique features; cost- effective and easy operation, unlike others. Many other studies mentioned in the introduction are useful and well performed (Alexandridis et al., 2007; Gerhards et al., 2002; Gerhards & Oebel, 2006; Goel et al., 2002; Pérez-Ortiz et al., 2015; Ribeiro et al., 2005). However, their methods have to be operated by very skilled persons using complex algorithms.
In contrast, the current study requires relatively cheap camera (Sequoia, Parrot, France, around USD 3,500 or $3,500) mounted on the consumer affordable priced UAV (DJI F550 Hexa-rotor, Pixhawk, 3DR, USA, around USD 3,500 or $3,500). The images obtained from this camera are easily mosaicked and extracted using Pix4Dmapper Pro 3.0.17 and ArcGIS 10.1 software with a couple of training for the software operation. NDVI could be simply calculated using the values from four separate spectral sensors of green (550 BP 40), red (660 BP 40), red edge (735 BP 10), near infrared (790 BP 40) in the extracted images. Then, weed segmentation using NDVI histogram could be set based on the inflection point.
This method has a weak point, which is possible when the NDVI of the crop in the field and the weeds are different. However, the different NDVI between crop and weeds would be not rare because the leaf structure of crop and weeds in the same field would not frequently be same and their difference in leaf structure may necessitate species-specific calibration equations for its detection (Richardson et al., 2002). Thus, it could be applied to most fields for site-specific weed detection.
Another issue with the method in the current study is that the inflection point may not be very accurate. However, this should be acceptable because the whole purpose of this method is to know the weed patches in the field. Furthermore, the size of these weed patches does not need to be accurately measured. The weed patches for control should be large enough for efficient weed management. Small patches or individual weeds scattered across the field could not be threats for high yield potential. The decision for weed patch size could be determined based on a simulation study for economical site-specific management (Barroso et al., 2004). Furthermore, they do not generate the large size of seed bank which can be potential threats for the following year because the buried seed bank would allow weeds to become more abundant the following year (Thompson & Grime, 1979). Thus, this method in the current study should be enough to control the weeds in the postseason from the seed banks generated by the large weed patches.
Indeed, large weed patch control could be more efficient in terms of chemical usage due to seed bank compared with object-based analysis (Peña et al., 2013), which detects weeds at the individual basis. In this sense, the results from this study would be very useful for the weed control by target specific control with much less chemical usage in a cost-effective manner. Furthermore, it would be very helpful to sustain environments.
