INTRO
MATERIALS AND METHODS
SF Preparation
Storage conditions
Chemicals
Sample analysis
Statistical analysis
RESULTS AND DISCUSSION
Storage temperature conditions
Acid content
Conjugated diene content
Peroxide content
p-anisidine content
TBA content
Lipoxygenase activity
Storage conditions
CONCLUSIONS
INTRO
Legumes have been widely cultivated and consumed throughout Asia for a long time due to various health- promoting benefits (Wang et al., 2003). The soybean (Glycine max L.), belonging to the legume family, is a major crop that people can easily access. Approximately 10% of the world’s soybeans are used in a variety of food products, such as tofu and soy sauce. In 2016, the total soybean consumption in Korea was 1.49 million tons, including 0.42 million tons edible. However, the proportion of soybeans that are imported has greatly increased due to decreases in domestic cultivation area (Ministry of Agriculture, 2017).
The health effects of soybean-based products are widely recognized worldwide. Soybeans are an important source of proteins and lipids and contain low levels of saturated fat. Particularly, soybeans contain many nutrients, including high quality protein and high levels of dietary fiber. Soybeans contain a variety of vitamins as well as all 15 essential minerals (e.g., potassium, iron, phosphorus, and calcium) (Messina, 2016).
Phytochemicals in soybeans, such as is oflavones and tocopherols, are also beneficial to human health (Stephen, 1997). Thus, these bioactive constituents, with antioxidative, antifungal, and anticarcinogenic properties, allow soybeans to be used as functional crops (Carrao-Panizzi&Erhan, 2007). For example, the intake of soybean or soy products was reported to improve health, including addressing issues with menopause, cardiovascular disease, reduction of cholesterol synthesis in liver, cancer, and osteoporosis (D'Adamo&Sahin, 2014).
As proteins and lipids are important factors in determining soybean quality, soybeans have been developed to improve these factors, taking into account the nutritional value and quality of the soybean (Brumm&Hurburgh, 1990). Also, because of the functional aspect of the soybean, its breeders have made an effort to improve the quality and quantity of nutrients in soybean seeds (Jeong et al., 2010). It has been reported that starch content, which accounts for 35-40% of soybean biomass, affects its processing properties (Osho&Dashiell, 1998). Due to the high starch content and the associated soft texture, soybeans are more suitable for processing through boiling or as a fermented soybean paste.
People use soybeans in a variety of forms, including soymilk, paste, and soybean flour (SF). Raw soybean flour (RSF) is often used as material for making confectionery and baking. Of the various available soy products, only 0.008% was used in the form of flour in 2015 (Ministry of Agriculture, 2016). Currently, SF is used in many food products, ranging from baby cereals to pharmaceuticals (Ribotta et al., 2004).
To manufacture SF, dehulled soybeans are finely pulverized. SF is defined by the size of the particles passing through a 100-mesh standard screen (Thomas, 1981). There are various kinds of SF, including defatted, full-fat, low-fat, high-fat, and lecithinated. Low-fat, high-fat, and lecithinated SF are made by adding oil or lecithin to defatted SF (Okoye et al., 2008). As the composition of SF is quite different from that of common flour, such as wheat flour, it is sometimes called defatted soy solid, soy powder, or soy pulverate (Smith&Circle, 1972). When producing SF, some hull fragments may remain in the SF even after the dehulling process. Therefore, yellow beans are mainly used instead of black beans or brown beans, which may affect the color of SF (Prabakaran et al., 2018a,b).
In case of SF, products are easily available to consumers, but there are some issues, including rancidity (Min&Lee, 1999). Quality changes or nutritional loss can occur due to oxidation and browning during the distribution process, resulting in poor storage stability (Joung et al., 1997). The proteins and lipids in the SF cause oxidation, which produces volatile off-flavor and reduces amounts of essential fatty acids, including linoleic and linolenic acid. Also, products of lipid oxidation oxidize and decompose vitamins. Thus, oxidation decreases nutritional value and affects shelf life (Kim et al., 2008). The longer the storage period, the greater the effects of rancidity on SF (Farhoosh et al., 2009).
When the RSF is used as a food ingredient in soup, noodles, confectionery, or baking, problems such as beany flavor or texture may arise (Krupa et al., 2010). The beany flavor is due to oxidation of unsaturated fatty acids to volatile compounds and hydroperoxides catalyzed by the lipoxygenase (linoleate-oxygen oxidoreductase, EC 1.13.11.12), resulting in rancidity and poor storage stability (Priestley&Leopold, 1979). The development of off-flavors during processing and storage seriously limits the full utilization of RSF. Apart from enzymatic deterioration due to lipoxygenase, non-enzymatic decomposition of lipid peroxides is also a problem (Agrahar- Murugkar&Jha, 2011). The resulting odors are difficult to remove or hide because they have various odor components that are tightly attached to the soy protein molecule (Lee et al., 1996).
The beany flavor can be removed by non-heat treatment, such as germination, or heat treatment, such as roasting and steaming (Shin et al., 2013). Therefore, the heat treatment (boiling or steaming) in the manufacturing process inactivates the lipoxygenase, which greatly reduces the beany flavor of the SF (Yemenicioğlu et al., 1998). Also, heat treatment of SF deactivates trypsin inhibitors, which are involved in limiting soybean absorption, resulting in increased nutritional properties and greater digestibility (Andrade et al., 2016). By promoting the rate of enzymatic hydrolysis of proteins and dietary fiber, heat treatment of SF can improve the digestibility of soybean starch (Ovando-Martínez et al., 2011).
As heat treatment affects the browning and protein solubility of SF, the heating method, including temperature and duration, should be appropriately adjusted when boiling or roasting (Machado et al., 2008). Lipid oxidation of SF is caused by autoxidation, which occurs naturally through the reaction of unsaturated fatty acids to oxygen (Gray, 1978). Autoxidation of SF can occur during processing and storage via a free radical chain reaction that occurs in stages of initiation, propagation, and termination involving singlet oxygen (Lee&Choe, 2003). Autoxidation is a characteristic form of oxidation that is accelerated at a high temperature (HT). At temperatures below zero its rate is suppressed but never stopped (Lee et al., 2005). In this study, six rancidity measurement methods were conducted in order to compare the long-term and short-term storage stability of SF.
Although SF is a food product that can be widely used for various purposes, to the best of our knowledge, few studies have been conducted on manufacturing conditions and packaging materials. Therefore, the purpose of this research was to investigate quality changes of RSF and roasted soybean flour (ROSF) during storage, and the effects of different packaging materials and storage temperatures on storage stability. Furthermore, this study will provide useful information for industrial use of SF and be used as a basis for the development of technology to prevent or delay rancidity.
MATERIALS AND METHODS
SF Preparation
In this study, SF was made from the soybean cultivar “Saedanbaek”. The SF was manufactured in two forms, namely powdered RSF and ROSF by conventional conditions. Saedanbaek was obtained from the Rural Development Administration (RDA) in Korea (2016).
Storage conditions
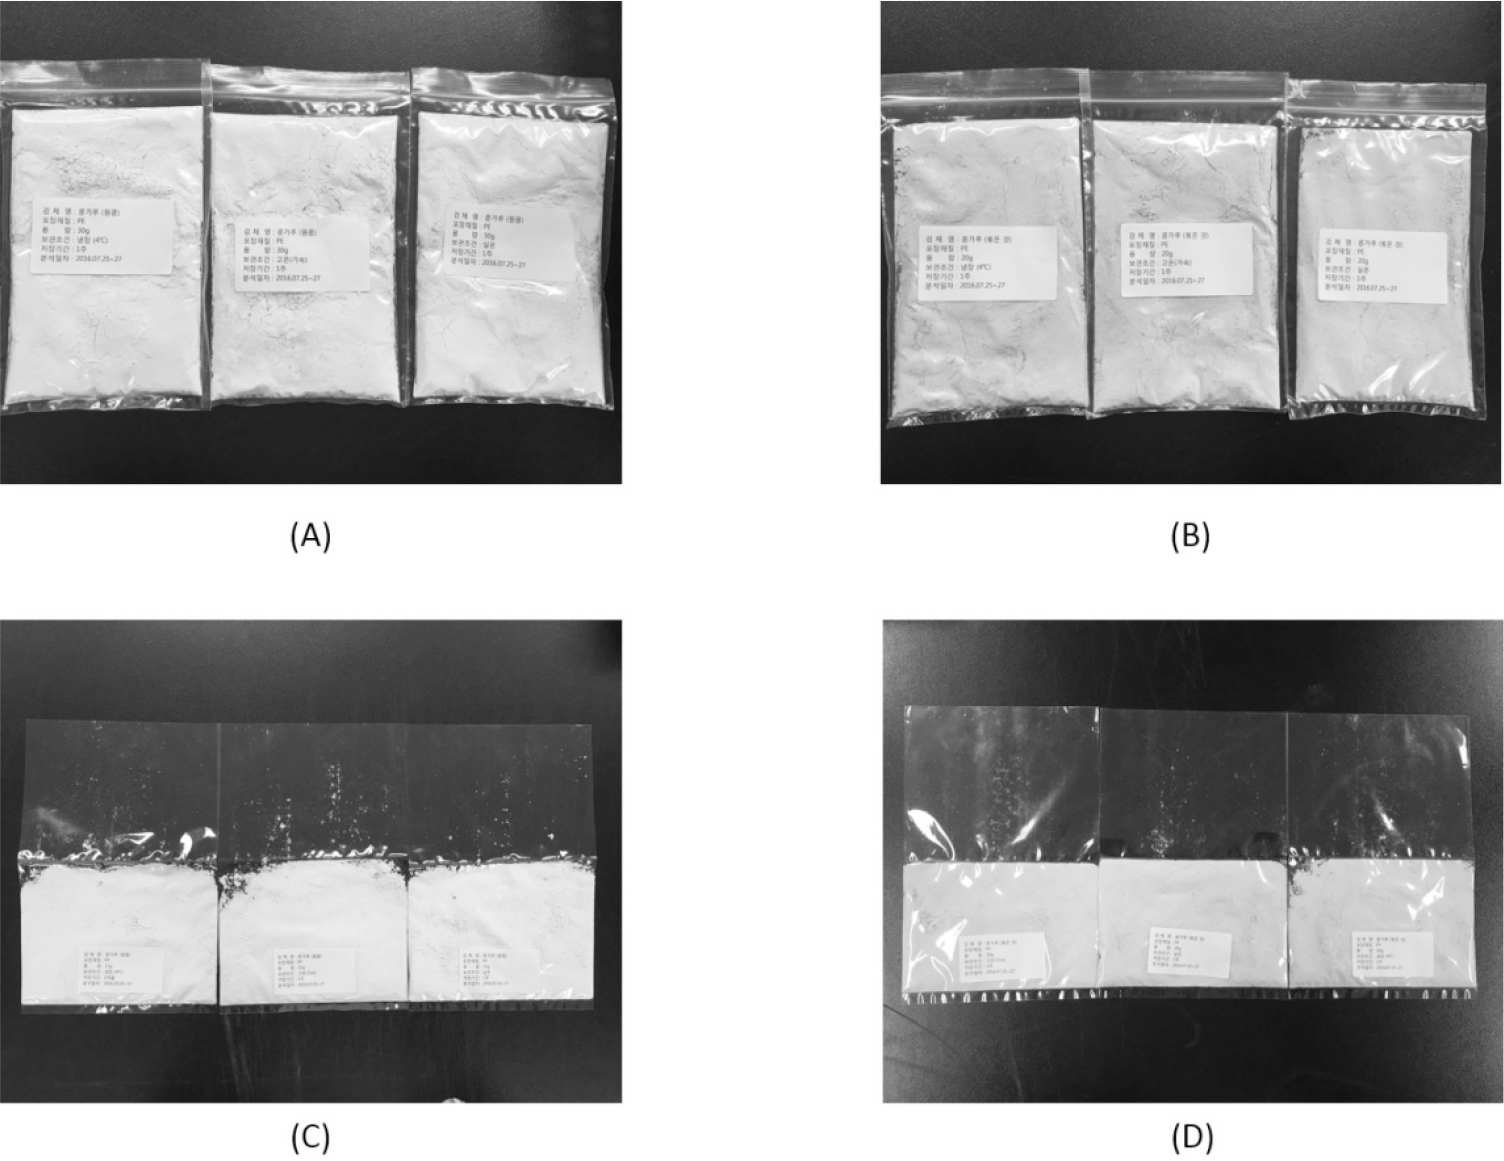
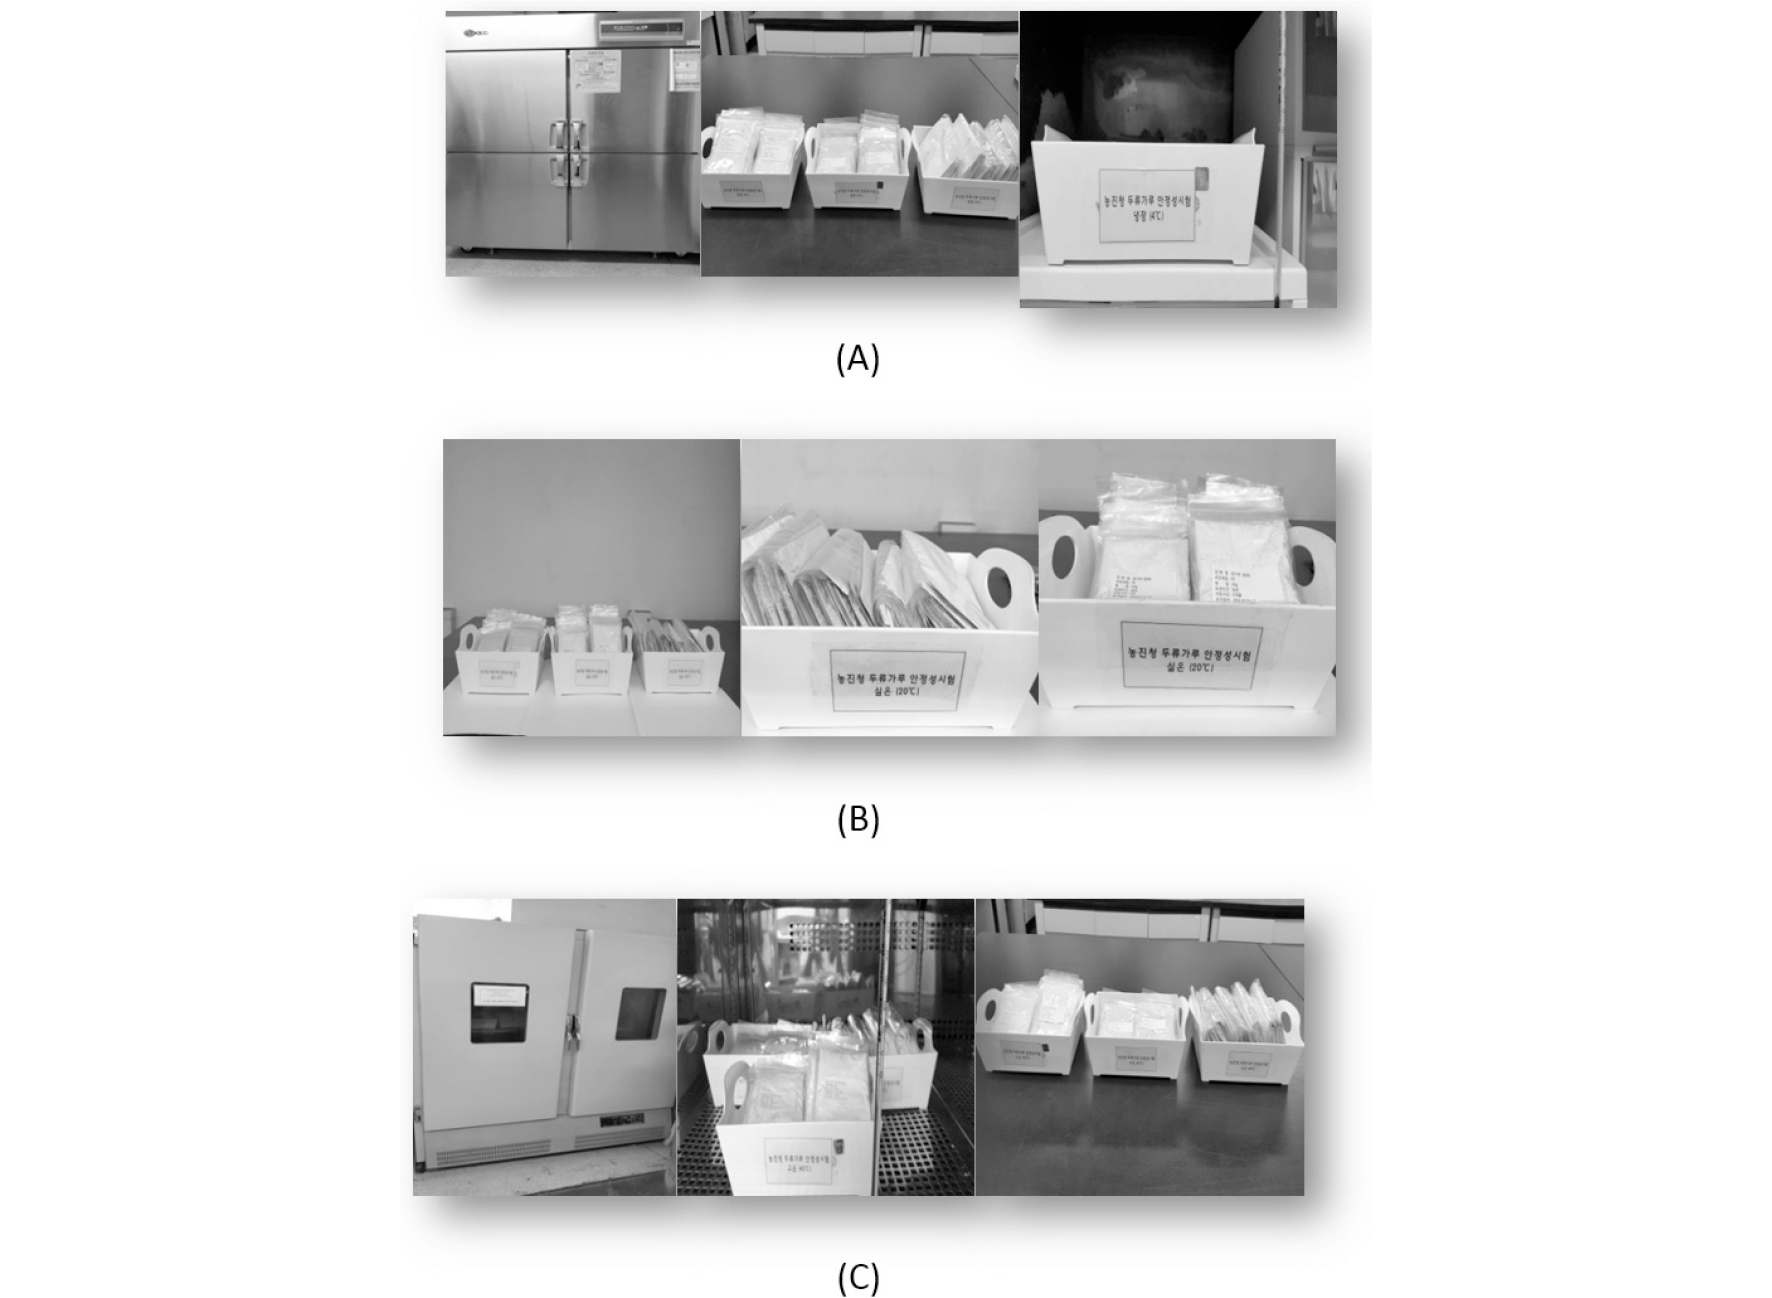
The RSF and ROSF were packaged in PE (PE, 10 × 15 cm : width × length, thickness 0.05 mm) and PPE (PP, 15 × 20 cm : width × length, thickness 0.04 mm) film bags (Fig. S1, Supplementary material is available online) and sealed on four sides by heat sealer (Lovero Bag Sealer, SK-310; Sambo Tech Co., Gyeonggi-Do, Korea). After sealing, the RSF and ROSF were stored at three different storage temperatures (4, 20, and 45°C) for 1 year as in Fig. S2 (Supplementary material is available online). The acid, conjugated diene, peroxide, p-anisidine, thiobarbituric acid (TBA) values, and lipoxygenase activity were measured at initial storage, and after 1, 2, 4, 8, 12, 24, 36, and 48 weeks for each storage condition (temperature and packaging) to measure the rancidity. All the assays were done in triplicate to ensure error free results.
Chemicals
All chemicals used for the analysis of stability were HPLC and extra pure grade. Diethyl ether and 0.01 N sodium thiosulfate solution were purchased from Duksan Pure Chemical Co. (extra pure grade; Seoul, Korea). Ethanol (EtOH) and iso-octane were purchased from Thermo Fisher Scientific Korea Ltd, Seoul, Korea. Phenolphthalein was purchased from Samchun Chemical Co. (special grade; Seoul, Korea) and 0.1 N potassium hydroxide in ethanol and sodium hydroxide were from Samchun Chemical Co. Seoul, Korea. Acetic acid glacial and methanol (MeOH) were purchased from J.T. Baker (Phillipsburge, NJ, USA). Chloroform, sulfuric acid, and tris (hydroxymethyl) aminomethane were purchased from Daejung Chemical&Materials Co. Ltd. (Gyeonggi-Do, Korea). Potassium iodide was purchased from Yakuri Pure Chemicals Co. Ltd. (Japan). Benzene and heptane were purchased from Junsei Chemical Co., Ltd. (Guaranteed reagent; Japan). Tween 20 and methylene chloride were purchased from Sigma-Aldrich Corp. (Premium quality; St. Louis, USA). The triple distilled water was collected from PURELAB Option-Q System (ELGA LabWater, UK).
Sample analysis
Acid content
The acid value of SF was evaluated by using the AOCS Official Method (Cd 3d-63) depending on storage conditions. A SF sample weighing 1 g was extracted with an ether- ethanol mixture (50 mL) in a 100-mL Erlenmeyer flask. The solution was shaken at 250 rpm for 60 min using a shaker (Green-SSeriker, Vision Scientific Co. Ltd., Gyeonggi-Do, Korea). After shaking, the extracted sample was added to 1%-phenolphthalein solution and titrated against 0.1 N potassium hydroxide prepared in ethanol. The end point was reached when the sample showed a reddish color for 30 s. A blank test was used for calibration. The acid value of each sample was calculated as follows:
| $$Acid\;value\;(mg/g)=\frac{(V_1-V_0)\times5.611\times F}S$$ |
where V1 is the amount of 0.1 N potassium hydroxide in ethanol solution in final test (mL), V0 is the amount of 0.1 N potassium hydroxide in ethanol solution in blank test (mL), F is the titer of 0.1 N potassium hydroxide in ethanol solution (f), and S is the amount of sample (g).
Conjugated diene content
The conjugated diene value of SF was evaluated using the AOCS Official Method (Ti 1a64) depending on storage conditions. An SF sample weighing 0.5 g in a 50-mL falcon tube was added to hexane (25 mL). The solution was shaken at 250 rpm for 60 min on a shaker. After shaking, it was centrifuged at 3000 rpm for 5 min. The absorbance of the supernatant was measured at 254 nm using a UV/Vis spectrophotometer (OPTIZEN POP, Mecasys, Korea). The conjugated diene value of each sample was calculated as follows:
| $$Conjugated\;diene\;value\;(\%)=\frac{0.84\times A_{254}}{bc-K_0}$$ |
where K0 is the absorbance coefficient of acid (0.03), A254 is the absorbance in 254 nm, b is the length of cell (cm), and c is the amount of sample per 1 g (g).
Peroxide content
The peroxide value of the SF was evaluated using the AOAC Official Method (Cd 965.33) depending on storage conditions. A SF sample weighing 5 g was added to hexane (30 mL) in a 100-mL Erlenmeyer flask. The mixed solution was shaken at 250 rpm for 60 min on a shaker. After shaking, it was transferred to a 50-mL falcon tube and centrifuged at 3000 rpm for 5 min at 4°C (VS-6000CFi, Vision Scientific Co. Ltd., Gyeonggi-Do, Korea). The supernatant was evaporated using a rotary vacuum evaporator at 40°C (Eyela, Tokyo Rikakikai, Co. Ltd.). The evaporated residues were first extracted with (3:2, v/v) acetic acid-chloroform solution (5 mL). Then, 10 mL of additional (3:2, v/v) acetic acid- chloroform solution was added to the evaporated residues twice, and the extracted sample was transferred to a 100 mL Erlenmeyer flask. To this, 1 mL of potassium iodide saturated solution was added, the flask was closed with a rubber stopper and was quickly mixed and left for 10 min in the dark. After 10 min, 5 mL of 1% starch soluble solution was added to the sample and the resulting mixture was titrated against 0.01 N sodium thiosulfate solution (Na2S2O3). The end point was identified by the transformation from a cyan or orange color to a transparent or white color. A blank test was used for calibration. The peroxide value of each sample was calculated as follows:
| $$Peroxide\;value\;(m\;Eq/kg)=\frac{(V_1-V_0)\times0.01\times F}S$$ |
where V1 is the amount of 0.01 N sodium thiosulfate solution (Na2S2O3) solution in final test (mL), V0 is the amount of 0.01 N sodium thiosulfate solution (Na2S2O3) solution in blank test (mL), F is the titer of 0.01 N sodium thiosulfate solution (Na2S2O3) solution (f), and S is the amount of sample (g). One milliliter of 1 N sodium thiosulfate solution (Na2S2O3) = hydroperoxide 1 mEq. One milliliter of 0.01 N sodium thiosulfate solution (Na2S2O3) = hydroperoxide 0.01 mEq.
p-anisidine
The p-anisidine value of SF was evaluated using the AOCS official method (Cd 18-90) depending on storage conditions. A SF sample weighing 0.2 g was added to iso-octane (25 mL) in a 50-mL falcon tube. The mixed solution was shaken at 250 rpm for 60 min on a shaker. After shaking, it was centrifuged at 3000 rpm for 5 min at 4°C. Both supernatant (3 mL) alone and supernatant (3 mL) added to p-anisidine solution (0.6 mL) were left for 10 min in the dark. The p-anisidine value for each was then measured at 350 nm using a UV/Vis spectrophotometer. Using the two values, the peroxide value of each sample was calculated as follows:
| $$p-Anisidine\;value\;(\%)=\frac{25\times(1.2A_s-A_b)}S$$ |
where As is the absorbance of sample with p-anisidine, Ab is the absorbance of sample without p-anisidine, and S is the amount of sample (g).
TBA content
The TBA value of SF was evaluated using the AOCS Official Method (Cd 19-90) depending on storage conditions. A SF sample weighing 1 g was added to benzene (10 mL) in a 50-mL falcon tube. The mixed solution was shaken at 250 rpm for 60 min on a shaker. After shaking, it was centrifuged at 3000 rpm for 5 min at 4°C. The supernatant in a 50-mL falcon tube was added to a thiobarbituric acid (TBA) solution and hand-shaken for 5 min and left until layer separation was observed. The lower-layer (5 mL) solution was transferred to a 20-mL vial and was heated at 80 rpm for 30 min using water-bath of approximately 90°C. After 30 min, it was removed and cooled in running tap water to measure it at 530 nm using a UV/Vis spectrophotometer against distilled water as blank. The TBA value of each sample was calculated as follows:
| $$TBA(Thiobarbituric\;acid)\;value\;(\%)-\frac{(A-B)\times1\times100}S$$ |
where A is the absorbance of sample at 530 nm, B is the absorbance of blank at 530 nm, and S is the amount of sample (g).
Lipoxygenase activity
The lipoxygenase activity of SF was evaluated using a previously defined research method described by Lee et al. with some modifications (Lee et al., 2005).
Crude enzyme solution: To 300 mg of soybean oil, 0.05 M tris aminomethane-hydrochloric acid (10 mL, pH 7) containing 20 mM calcium chloride (CaCl2) was shaken at 250 rpm for 60 min. After shaking, the extracted sample was centrifuged at 3000 rpm for 5 min at 4°C. The resulting supernatant was used as a crude enzyme solution.
To create a matrix solution, 6.6 mg of linoleic acid was dissolved in 2 N of sodium hydroxide (1.4 mL) in a 250 mL volumetric flask. To this, distilled water (21.4 mL) and Tween 20 (0.9 mL) were added and gently shaken to avoid foaming. The resulting solution was topped up to 250 mL, after correcting the pH value to 9 using 0.2 M tris aminomethane- HCl and stirred to create the final solution.
To measure the lipoxygenase activity, 3.41 mL of the matrix solution was mixed in to the crude enzyme (0.08 mL) solution, and absorbance was measured at 254 nm for every minute for 10 min using a UV/Vis spectrophotometer.
Statistical analysis
The statistical analysis was performed using SAS software (version 9.4; SAS Institute Inc., Cary, NC, USA). A general linear model (GLM) and the least significant difference (LSD) test were conducted at the 0.05 probability level to evaluate differences among samples.
RESULTS AND DISCUSSION
Autoxidation occurs by spontaneous reaction between the triplet oxygen present in the air and the lipid radicals, affecting nutritional quality (Lee&Choe, 2003). Here, we evaluated the extent of rancidity when two types of SF, including RSF and ROSF, were sealed in polyethylene (PE) or polypropylene (PPE) film bags to block oxygen and stored at three different temperatures (4°C, 20°C, and 45°C).
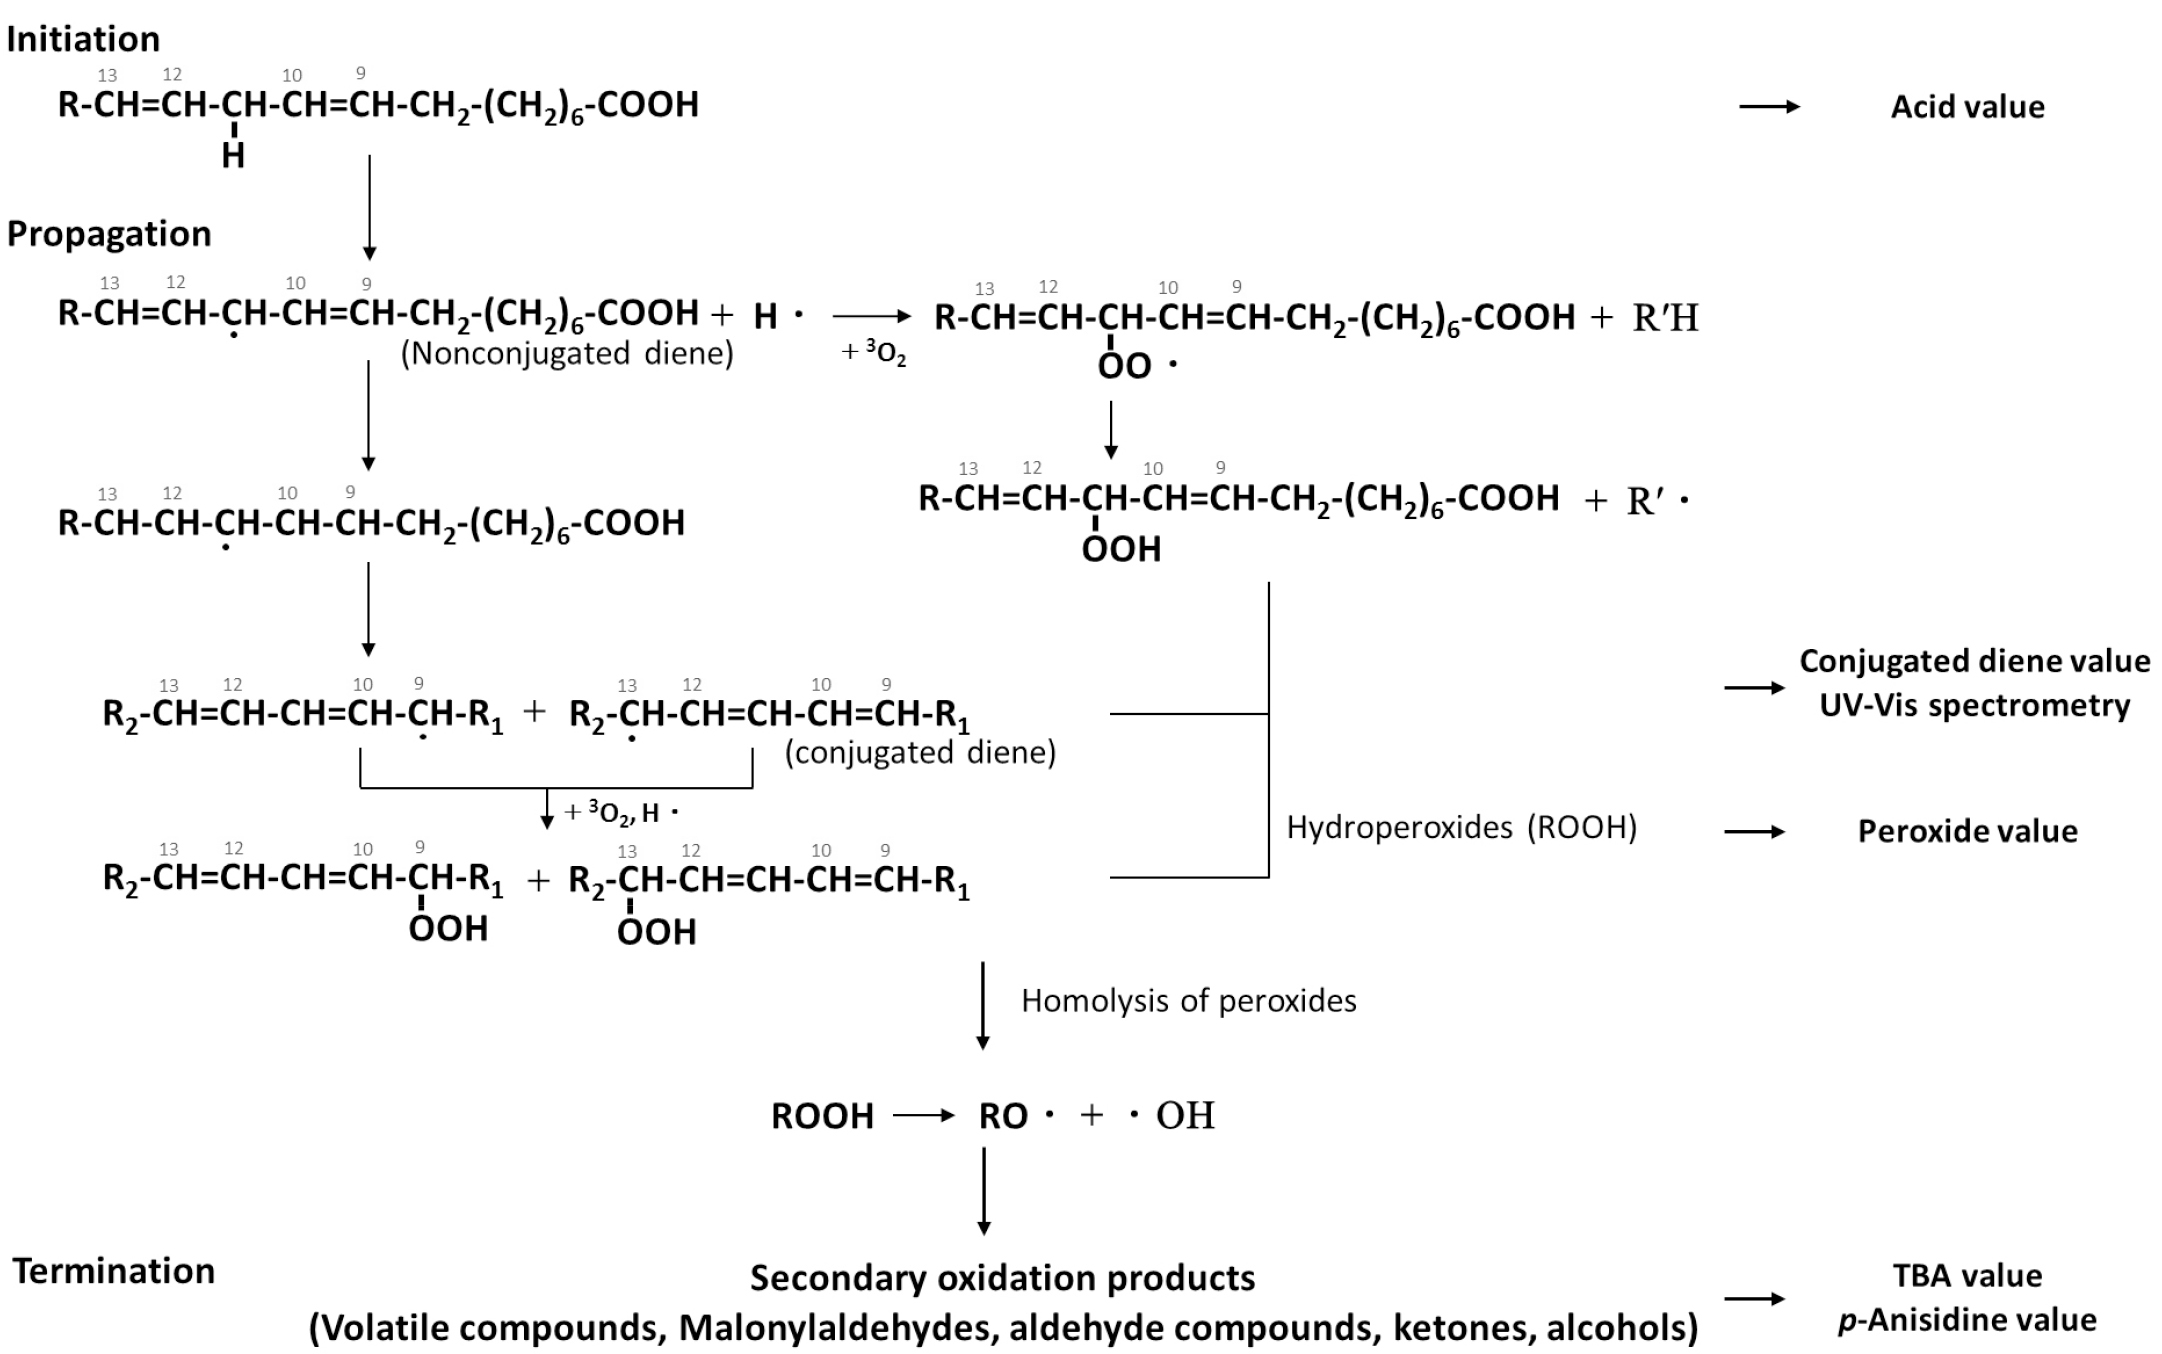
In autoxidation, lipids must have a radical form because of the radical properties of triple oxygen (Fig. S3; Supplementary material is available online). Peroxides, primary oxidation products of lipids, are relatively stable at room temperature (RT), but are readily degraded by metals, temperature, oxygen, and light. The peroxyl radicals (ROO·) produced by the decomposition of peroxides are reactive oxygen species that are more reactive than triplet oxygen in the air, further promoting lipid oxidation.
This oxidation produces secondary oxidation products, including aldehydes, alcohol, and carboxylic acids. These secondary oxidation products, produced by hydroperoxides, are widely used as indicator compounds, especially for evaluating the oxidation of lipids (Gray, 1978; Lee&Choe, 2003; Shahidi&Zhong, 2010; Yoon et al., 2015). In the termination step, some active radicals bind to each other, resulting in a polymerization reaction and the termination of the radical reaction (Yoon et al., 2015). Therefore, it is possible to measure the rancidity by colorimetrically quantifying the oxidation products formed in each oxidation step.
Storage temperature conditions
The acid, conjugated diene, peroxide, p-anisidine, and TBA values, and lipoxygenase activity of RSF and ROSF stored in PE and PPE film bags at 4, 20, and 45°C are given in Tables 1-4. The acid value is a standard value indicating the degree of rancidity of the lipid and is essential to evaluate the quality of the lipid contained in the food. Using the acid value, it is possible to estimate the degree of refinement or degradation of the food (Chae et al., 2010). Most of the lipid is neutral, but it decomposes into glycerol and free fatty acids, depending on the storage period and conditions. Therefore, the extent of rancidity can be estimated according to the amount of free fatty acid produced (Yoon et al., 2015). In general, when heat treatment is carried out at HT, the triglycerides are hydrolyzed to fatty acid to increase the production of free fatty acid, leading to oxidation and an increase in the acid value (Cho&Park, 2000).
Table 1. Characteristics of RSF stored in PE film bags.
Data are expressed as mean ± standard deviation. Different superscripts (a-f) denote significant differences among the nine storage period groups for each temperature conditions (p < 0.05). Values with similar superscripts are not significantly different from each other.
Table 2. Characteristics of RSF stored in PPE film bags.
Data are expressed as mean ± standard deviation. Different superscripts (a-f) denote significant differences among the nine storage period groups for each temperature conditions (p < 0.05). Values with similar superscripts are not significantly different from each other.
Table 3. Characteristics of ROSF stored in PE film bags.
Data are expressed as mean ± standard deviation. Different superscripts (a-g) denote significant differences among the nine storage period groups of each temperature conditions (p < 0.05). Values with similar superscripts are not significantly different from each other.
Table 4. Characteristics of ROSF stored in PPE film bags.
Data are expressed as mean ± standard deviation. Different superscripts (a-f) denote significant differences among the nine storage period groups of each temperature conditions (p < 0.05). Values with similar superscripts are not significantly different from each other.
As a result of the oxidation of lipids, the conjugated diene value increased as the double bonds became isomerized into a more thermodynamically stable double bond system. The peroxide value, a basic method for measuring the lipid hydroperoxide (a primary oxidation product), is used to measure the rancidity or induction period of lipids (Yoon et al., 2015).
Secondary oxidation products containing aldehyde compounds are formed by the autoxidation of lipid components, which undergo a color reaction. The amount of aldehyde increases as the rancidity of oil increases. Under acetic acid, p-anisidine reacts with an aldehyde to form a yellow complex, which can be used to calculate the amount of anisidine (Yoon et al., 2015). The TBA assay used to quantify the amount of the carbonyl compound (a secondary product of lipid oxidation) utilizes malondialdehyde belonging to the carbonyl compound to form a red color when reacting with 2-thiobarbituric acid.
Lipoxygenase (linoleate-oxygen oxidoreductase, EC 1.13.11. 12) is an enzyme present in some vegetables, such as soybeans, potatoes, and peas. It is reported that if the food structure is damaged by grinding and freezing, contact between the enzyme and lipids in food tissue leads to increased oxidation. As heat treatment restricts lipoxygenase activity, it is important to determine the initial quality of the oil to be used without going through a purification process such as compression (Priestley&Leopold, 1979; Yoon et al., 2015).
Acid content
The acid value increased during the first two weeks at refrigerated temperature (RFT), RT, and high temperature (HT), and then tends to decrease, as summarized in Tables 1-4. Nam et al. stated that acid value was 2.27 mg/g at initial storage, but steadily increased to 3.12, 4.09, 4.83, and 7.26 mg/g at 1, 2, 3, and 4 weeks, respectively (Nam et al., 2011). Oxidation of the lipid component occurs naturally at RT, and is accelerated as the temperature rises, while the rate of oxidation is suppressed at subzero temperatures but is not interrupted (Kim, 1994). These results are consistent with previous research results, which state that when the storage temperature is high, the rate at which the acid value increased was fast. Shin&Chung reported that, in case of the acid value of rice germ and bran during storage at 40 and 60°C, the rate at which the acid value increases is accelerated as temperature increases (Shin&Chung, 1998). It is considered that the initial increase in acid value is due to the fact that the area of contact with oxygen is increased and heat is generated by the pulverization during SF production. The decrease in the acid value after 8 weeks seems to be due to the completion of free fatty acid decomposition and the subsequent oxidation.
In particular, the acid value of ROSF stored at HT increased rapidly between 12 and 24 weeks, then decreased continuously after 24 weeks until 48 weeks as in Tables 1-4. Under HT storage, as the rancidity of ROSF is rapidly induced, the lipid oxidation continues. Thus, low-molecular- weight hydrocarbons and fatty acids containing pentane, heptanoic acid, and octanoic acid, which are secondary oxidation products, are produced by the decomposition of peroxides (Yoon et al., 2015). Therefore, low molecular weight fatty acids, such as octanoic acid produced by the degradation of fatty acid peroxides, are increased, resulting in increased acid value. However, unlike the acid value, the induction period of lipids is not significantly affected by the treatment method or storage temperature (Shin&Chung, 1998).
Conjugated diene content
The conjugated diene value determines the degree of initial oxidation of lipid containing unsaturated fatty acids with two or more double bonds in the beginning of oxidation (Yoon et al., 2015). At RFT and RT, the conjugated diene value of all SF was unchanged until 24 weeks but began to increase starting at 24 weeks, as shown in Tables 1-4. This was likely due to the influence of lipid autoxidation until 24 weeks and then by the initiation of lipid oxidation. Chung et al., reported that the conjugated diene values of soybean oil stored for 24 h in light and dark conditions were 0.239% and 0.042%, respectively, while values for soybean oil stored for 96 h in the dark increased to 0.227%. The conjugated diene value of SF stored at HT tends to increase continuously (Fig. 1). The increase in the conjugated diene value may be due to the HT conditions during storage leading to the oxidation of lipids, as in Tables 1-4. Kim et al. measured the conjugated diene value of edible soybean oil during 60°C storage for 30 days, and found that the initial conjugated diene value increased to 0.14%, 0.12% at 2 days, 0.24% at 4 days, 0.40% at 6 days, and 0.74% at 8 days (Kim et al., 2003). Notably, the conjugated diene value of ROSF stored at HT increased rapidly starting at 4 weeks before reaching a plateau during storage, as represented in Tables 1-4. The autoxidation of lipids was induced by heat treatment (roasting) for flour production, and then by storing at HT condition. The conjugated diene value decreased due to decomposition to form alkyl radicals and aldehydes.
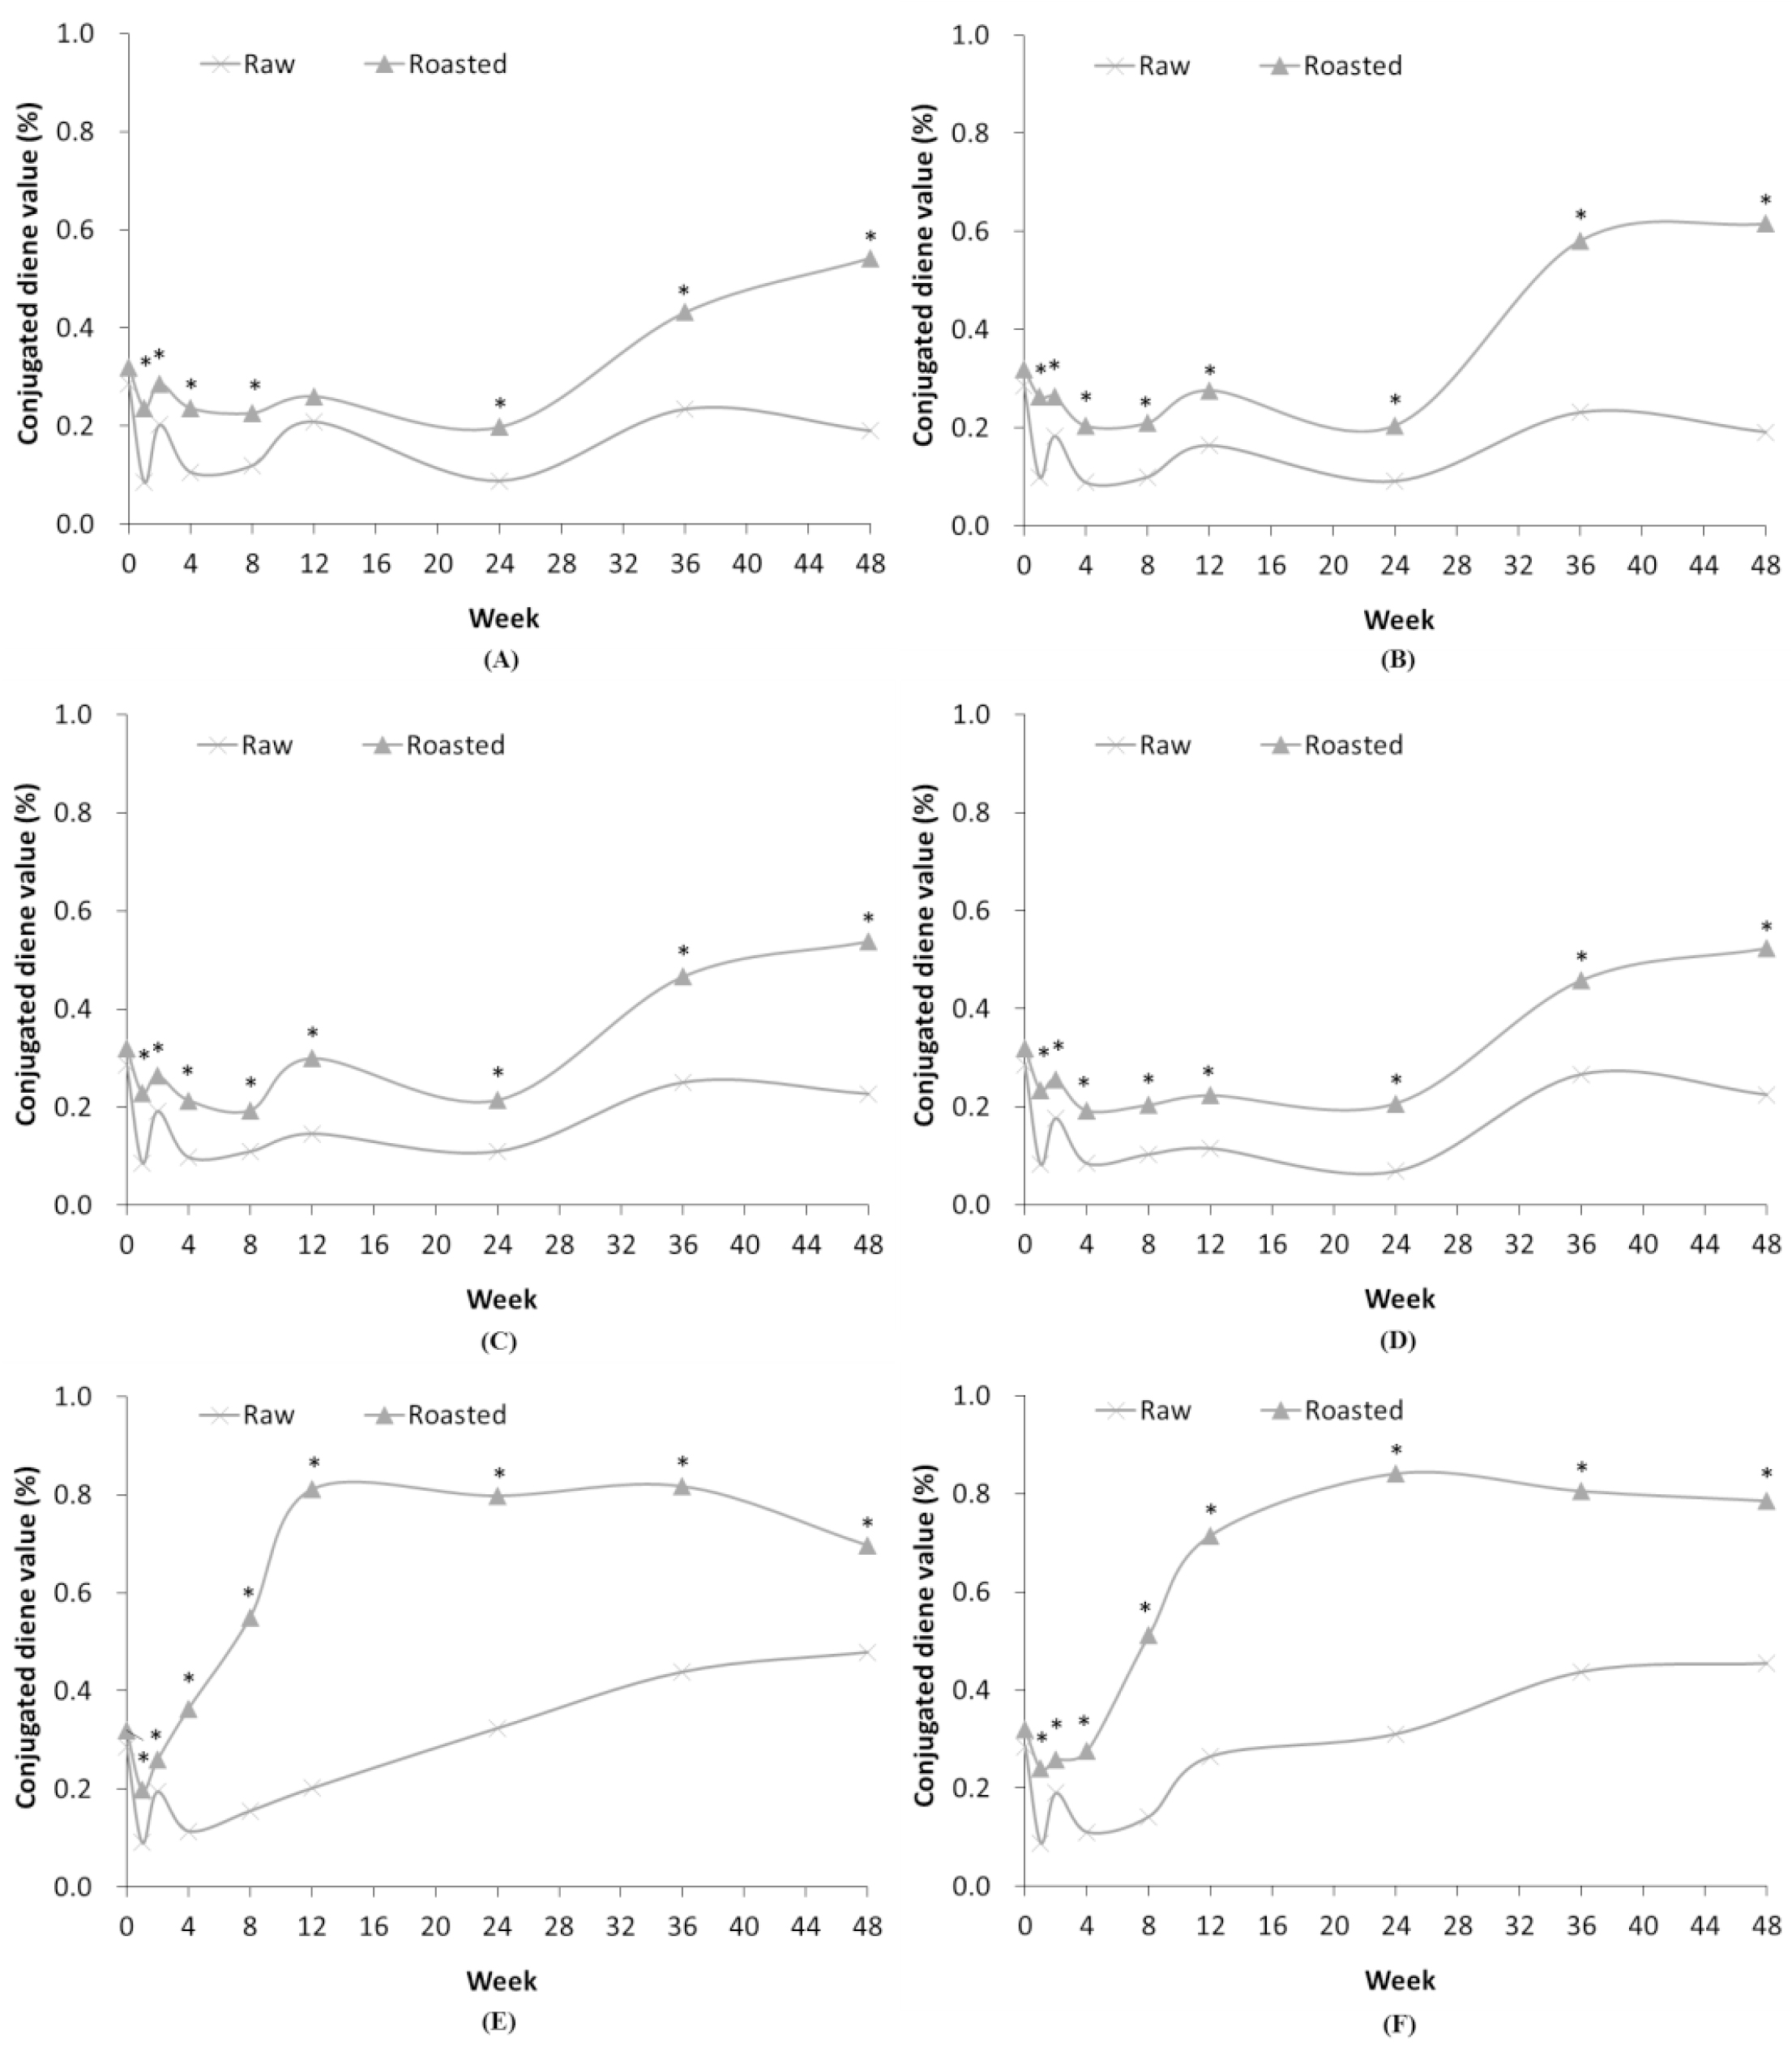
Fig. 1.
Comparison of conjugated diene values in RSF and ROSF under different storage conditions. Panels show RSF and ROSF stored in: (A) PE film bags; (B) PPE film bags at RFT; (C) PE film bags; (D) PPE film bags at RT; (E) PE film bags; and (F) PPE film bags at HT. Asterisks (*) denote significant differences in the conjugated diene values between RSF and ROSF (p < 0.05).
Peroxide content
At all storage temperatures, RSF stored in both types of packaging films indicated no change in peroxide value, as given in Tables 1 and 2. However, the peroxide value of ROSF stored at RFT and RT began to increase at 24 weeks. In the production of SF, heat treatment via a roasting process induces autoxidation of lipids, resulting in the increase in peroxide value (Yoon et al., 2015). Salariya&Habib also reported that the peroxide value of ginger extract stored at 45°C was 198.0 mEq/kg, but was 0.308 mEq/kg when stored at 25°C (Salariya&Habib, 2003).
In case of ROSF stored at HT condition, peroxide value increased sharply beginning at 4 weeks, and then decreased after 12 weeks, as given in Tables 3 and 4. As the lipid oxidation continues, peroxide values increase greatly, and then decrease because of the decomposition of peroxides. In work conducted by Bondioli et al., peroxide values tended to increase, with the increase starting at different times for different samples, but generally in the fifth month of ageing. Peroxide values increased slowly in samples that were initially not very oxidized, but for samples that had been initially oxidized, peroxide values first increased and then decreased due to the production of secondary oxidation products (Bondioli et al., 2003). Also, peroxide value is not a suitable indicator of oxidation process because peroxides easily decompose, especially in the presence of catalysts such as metal ion. Thus, peroxide value tends to increase to a maximum and then decrease as secondary oxidation products are formed. The peroxide value decreases rapidly after the induction period as the oxidation period elapses and becomes similar to the peroxide value of the fresh oil. Therefore, without knowing the history of the sample it is a drawback to use a lower peroxide value to understand the sample characteristics.
p-anisidine content
In all conditions, the p-anisidine values of both RSF and ROSF increased over the first 2 weeks and then decreased after 4 weeks, as given in Tables 1-4. After 12 weeks, the p-anisidine values of RSF stored at all temperature conditions tended to increase and then decrease. Also, p-anisidine value of ROSF stored at RFT and RT showed similar temporal trends to that of RSF. Tompkinsa stated that the p-anisidine value of soybean oil increased according to the heating or frying time (Tompkins&Perkins, 1999).
In case of ROSF stored at HT, the p-anisidine values increased greatly from 12 to 24 weeks, and then decreased until 48 weeks, as shown in Fig. 2 and Tables 3, 4. The conjugated diene and peroxide values reached their maximum at approximately 12 weeks, but the p-anisidine value was highest at 24 weeks. It is consistent with the previous results that secondary oxidation products, such as aldehydes, are formed by decomposition of peroxides as rancidity of lipid progresses. Unlike the method of measuring easily decomposed peroxide values, the p-anisidine value can be used to estimate progression in the rapid oxidation process of the oil. Particularly for oil that is oxidized at HT conditions, the p-anisidine value is more suitable than the peroxide value for estimating rancidity of SF.
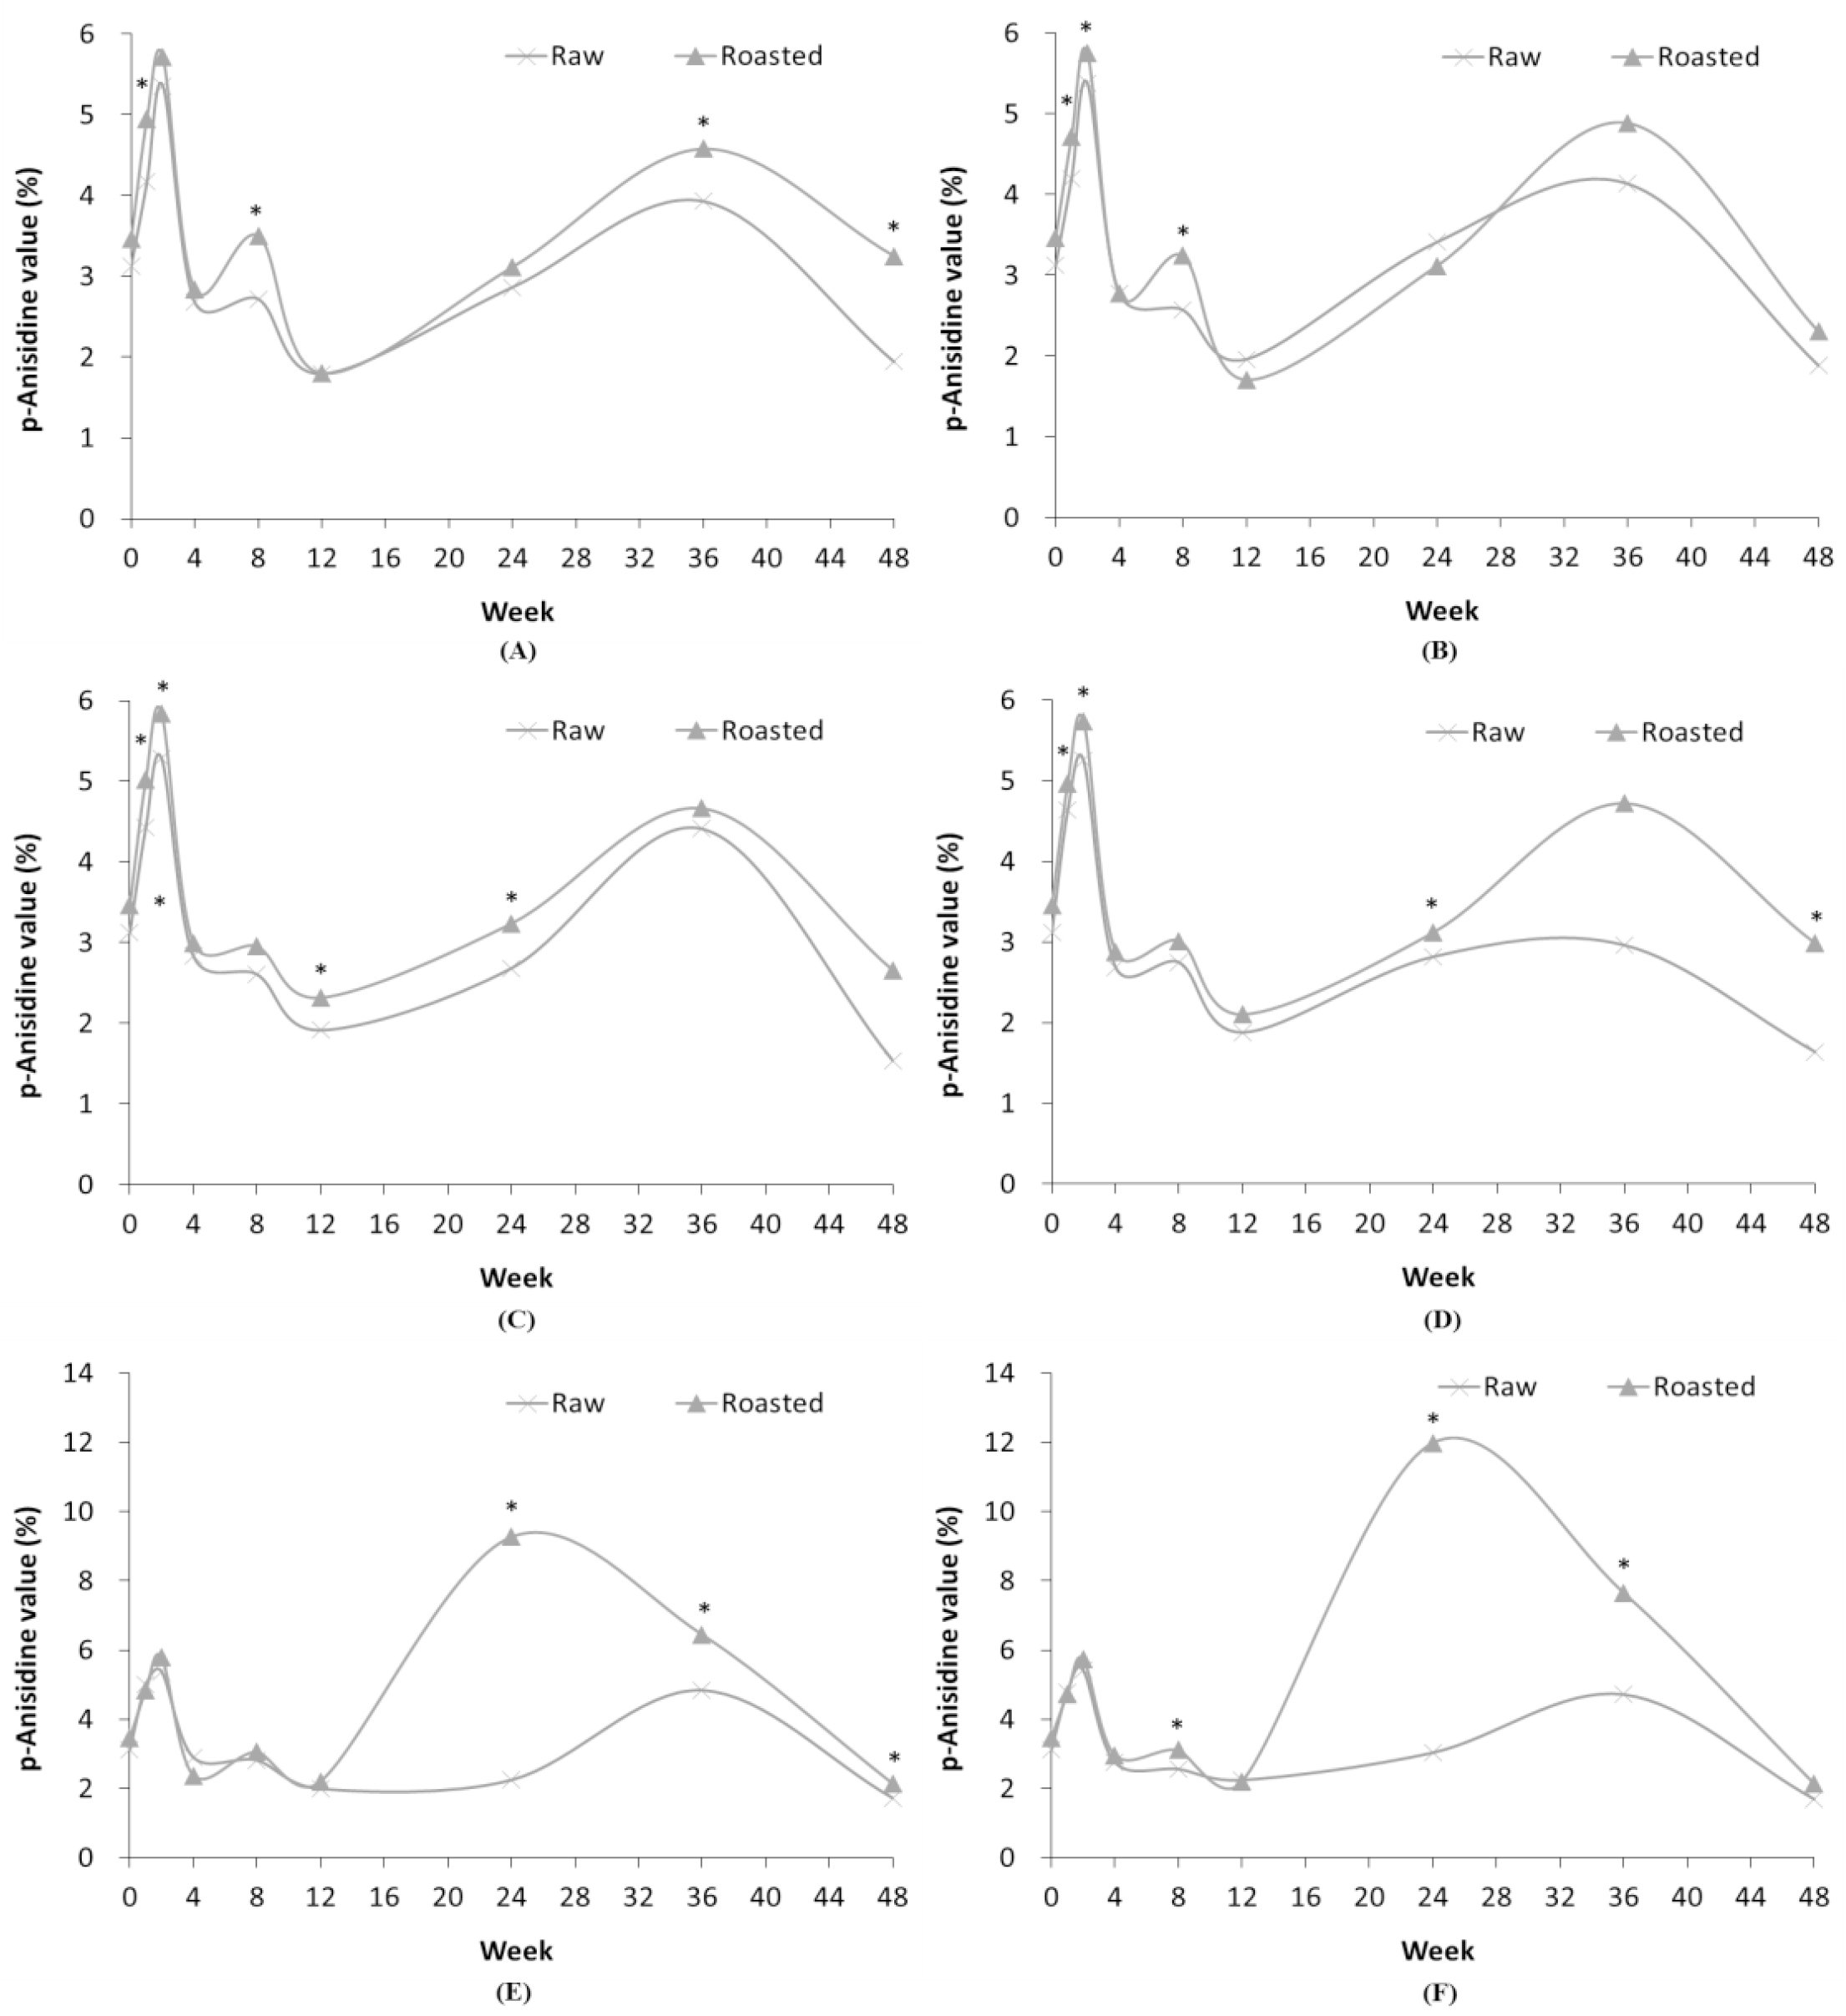
Fig. 2.
Comparison of p-anisidine levels in RSF and ROSF under different storage conditions. Panels show RSF and ROSF stored in: (A) PE film bags; (B) PPE film bags at RFT; (C) PE film bags; (D) PPE film bags at RT; (E) PE film bags; and (F) PPE film bags at HT. Asterisks (*) denote significant differences in the p-anisidine values between RSF and ROSF (p < 0.05).
TBA content
Though TBA analysis utilizes the malondialdehyde, the TBA value is considered less reproducible than peroxide value as various components other than malondialdehyde can also produce a color reaction with 2-thiobarbituric acid (Kim, 1994). Therefore, the continuous rise and fall of the TBA values (Tables 1-4; Fig. 3) are likely a result of the low reproducibility of the TBA value. The TBA value of freshly ground pork was 0.20 which increased in all packaging materials over time.
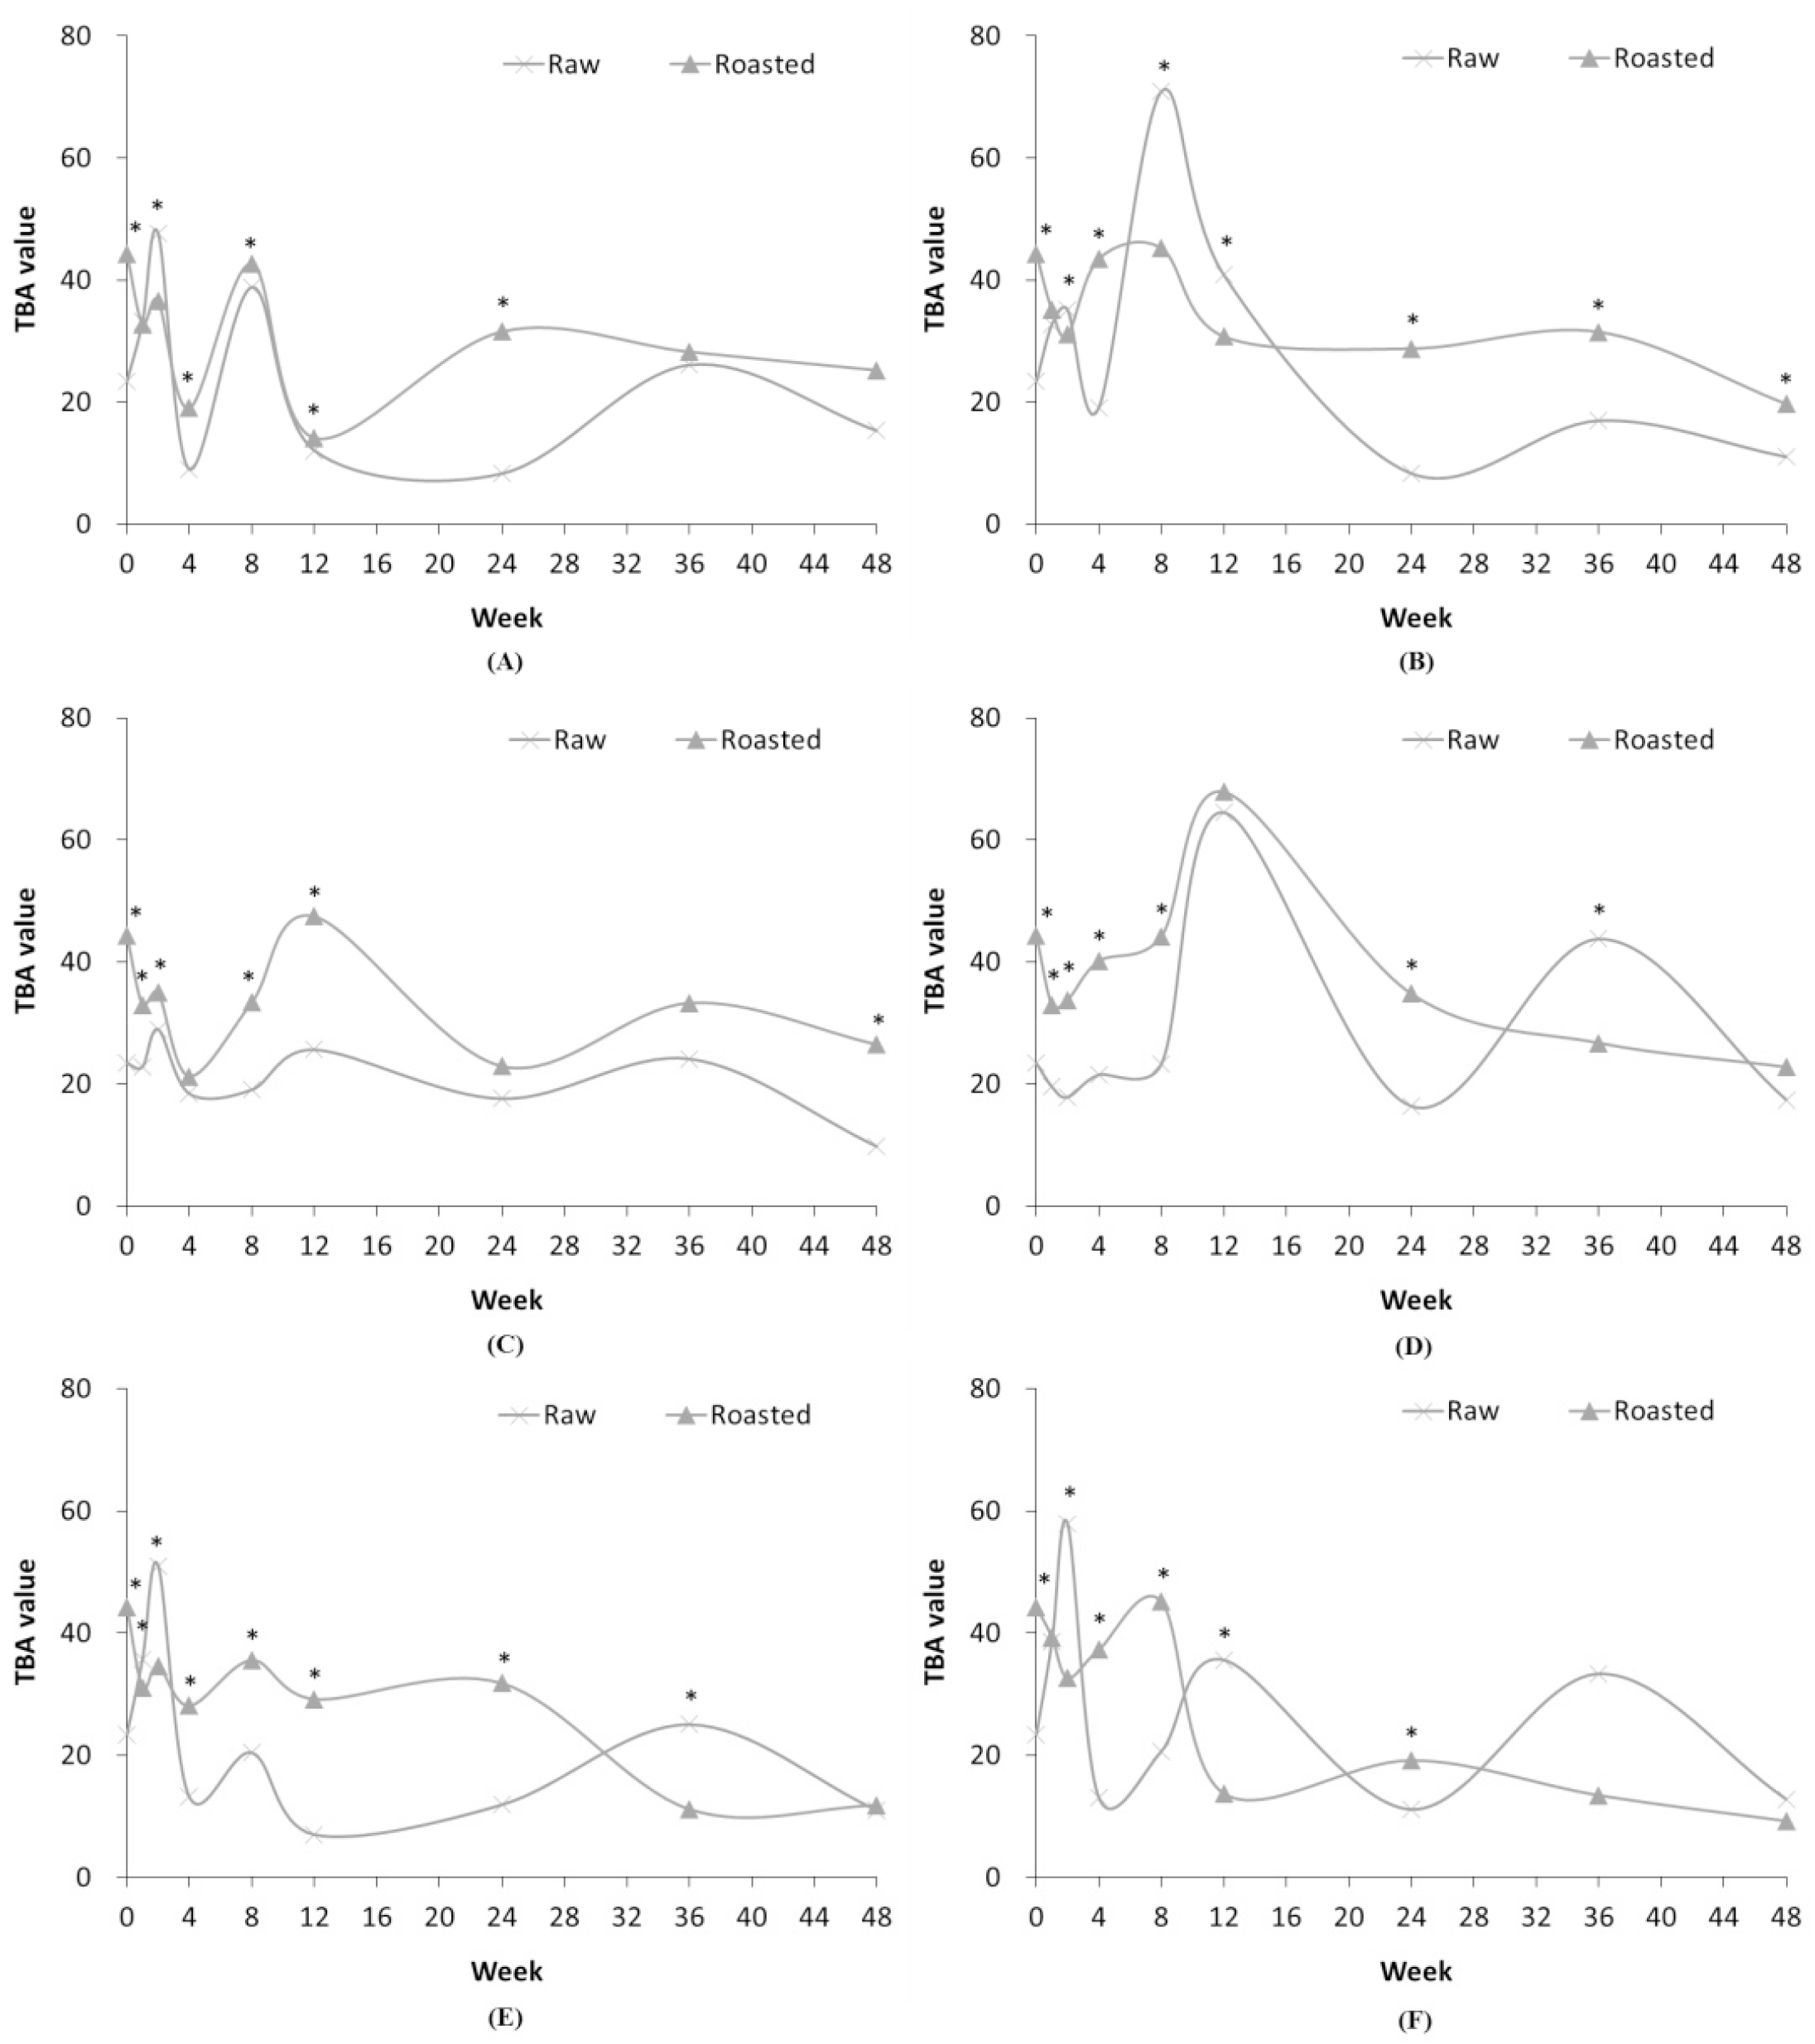
Fig. 3.
Comparison of TBA value in RSF and ROSF in different storage conditions. Panels show RSF and ROSF stored in: (A) PE film bags; (B) PPE film bags at RFT; (C) PE film bags; (D) PPE film bags at RT; (E) PE film bags; and (F) PPE film bags at HT. Asterisks (*) denote significant differences in the TBA values between RSF and ROSF (p < 0.05).
Lipoxygenase activity
In case of RSF, the lipoxygenase activity decreased when stored at HT, unlike when stored at RFT or RT, as represented in Tables 1 and 2. It appears that lipoxygenase activity is reduced by heat treatment at HT (Yemenicioğlu et al., 1998). Lipoxygenase activity of ROSF in all storage conditions was low continuously due to the heat treatment during grinding and roasting processes (Tables 3 and 4). The heat treatment of SF can reduce the lipoxygenase activity as well as the trypsin inhibitor, which inhibits the soybean digestion.
Comparing the oxidation stability among storage conditions, RSF stored at HT rapidly increased in acid value at the beginning of storage, then decreased. After the increase in acid values, the conjugated diene values also gradually started to increase until 48 weeks. In contrast, peroxide values did not significantly change. Although the p-anisidine value increased from 12 to 36 weeks, the increase was not large when compared with ROSF stored at HT. In case of the conjugated diene value, RSF stored at RFT and RT was lower than when stored at HT. Therefore, it appears that the oxidation of SF is slowly in progress and stable storage is possible for 48 weeks.
Storage conditions
For both types of storage (PE and PPE film bags), the acid values increased during the first 4 weeks and then decreased from 8 weeks onward, as shown in Fig. 4. The initial increase in acid value may be a result of autoxidation that had started due to the effect of temperature and the contact of moisture and oxygen during the pulverizing process in SF production. Peculiarly, the acidity of RSF was greater than that of ROSF until 12 weeks (Fig. 4). This is inconsistent with previous studies reported by Yoshida. Unlike RSF, acid value of ROSF increased rapidly between 12 and 24 weeks, then decreased when stored at HT. As the lipid oxidation continues, low molecular weight hydrocarbons, such as octanoic acid, are produced by the degradation of fatty acids (Yoon et al., 2015).
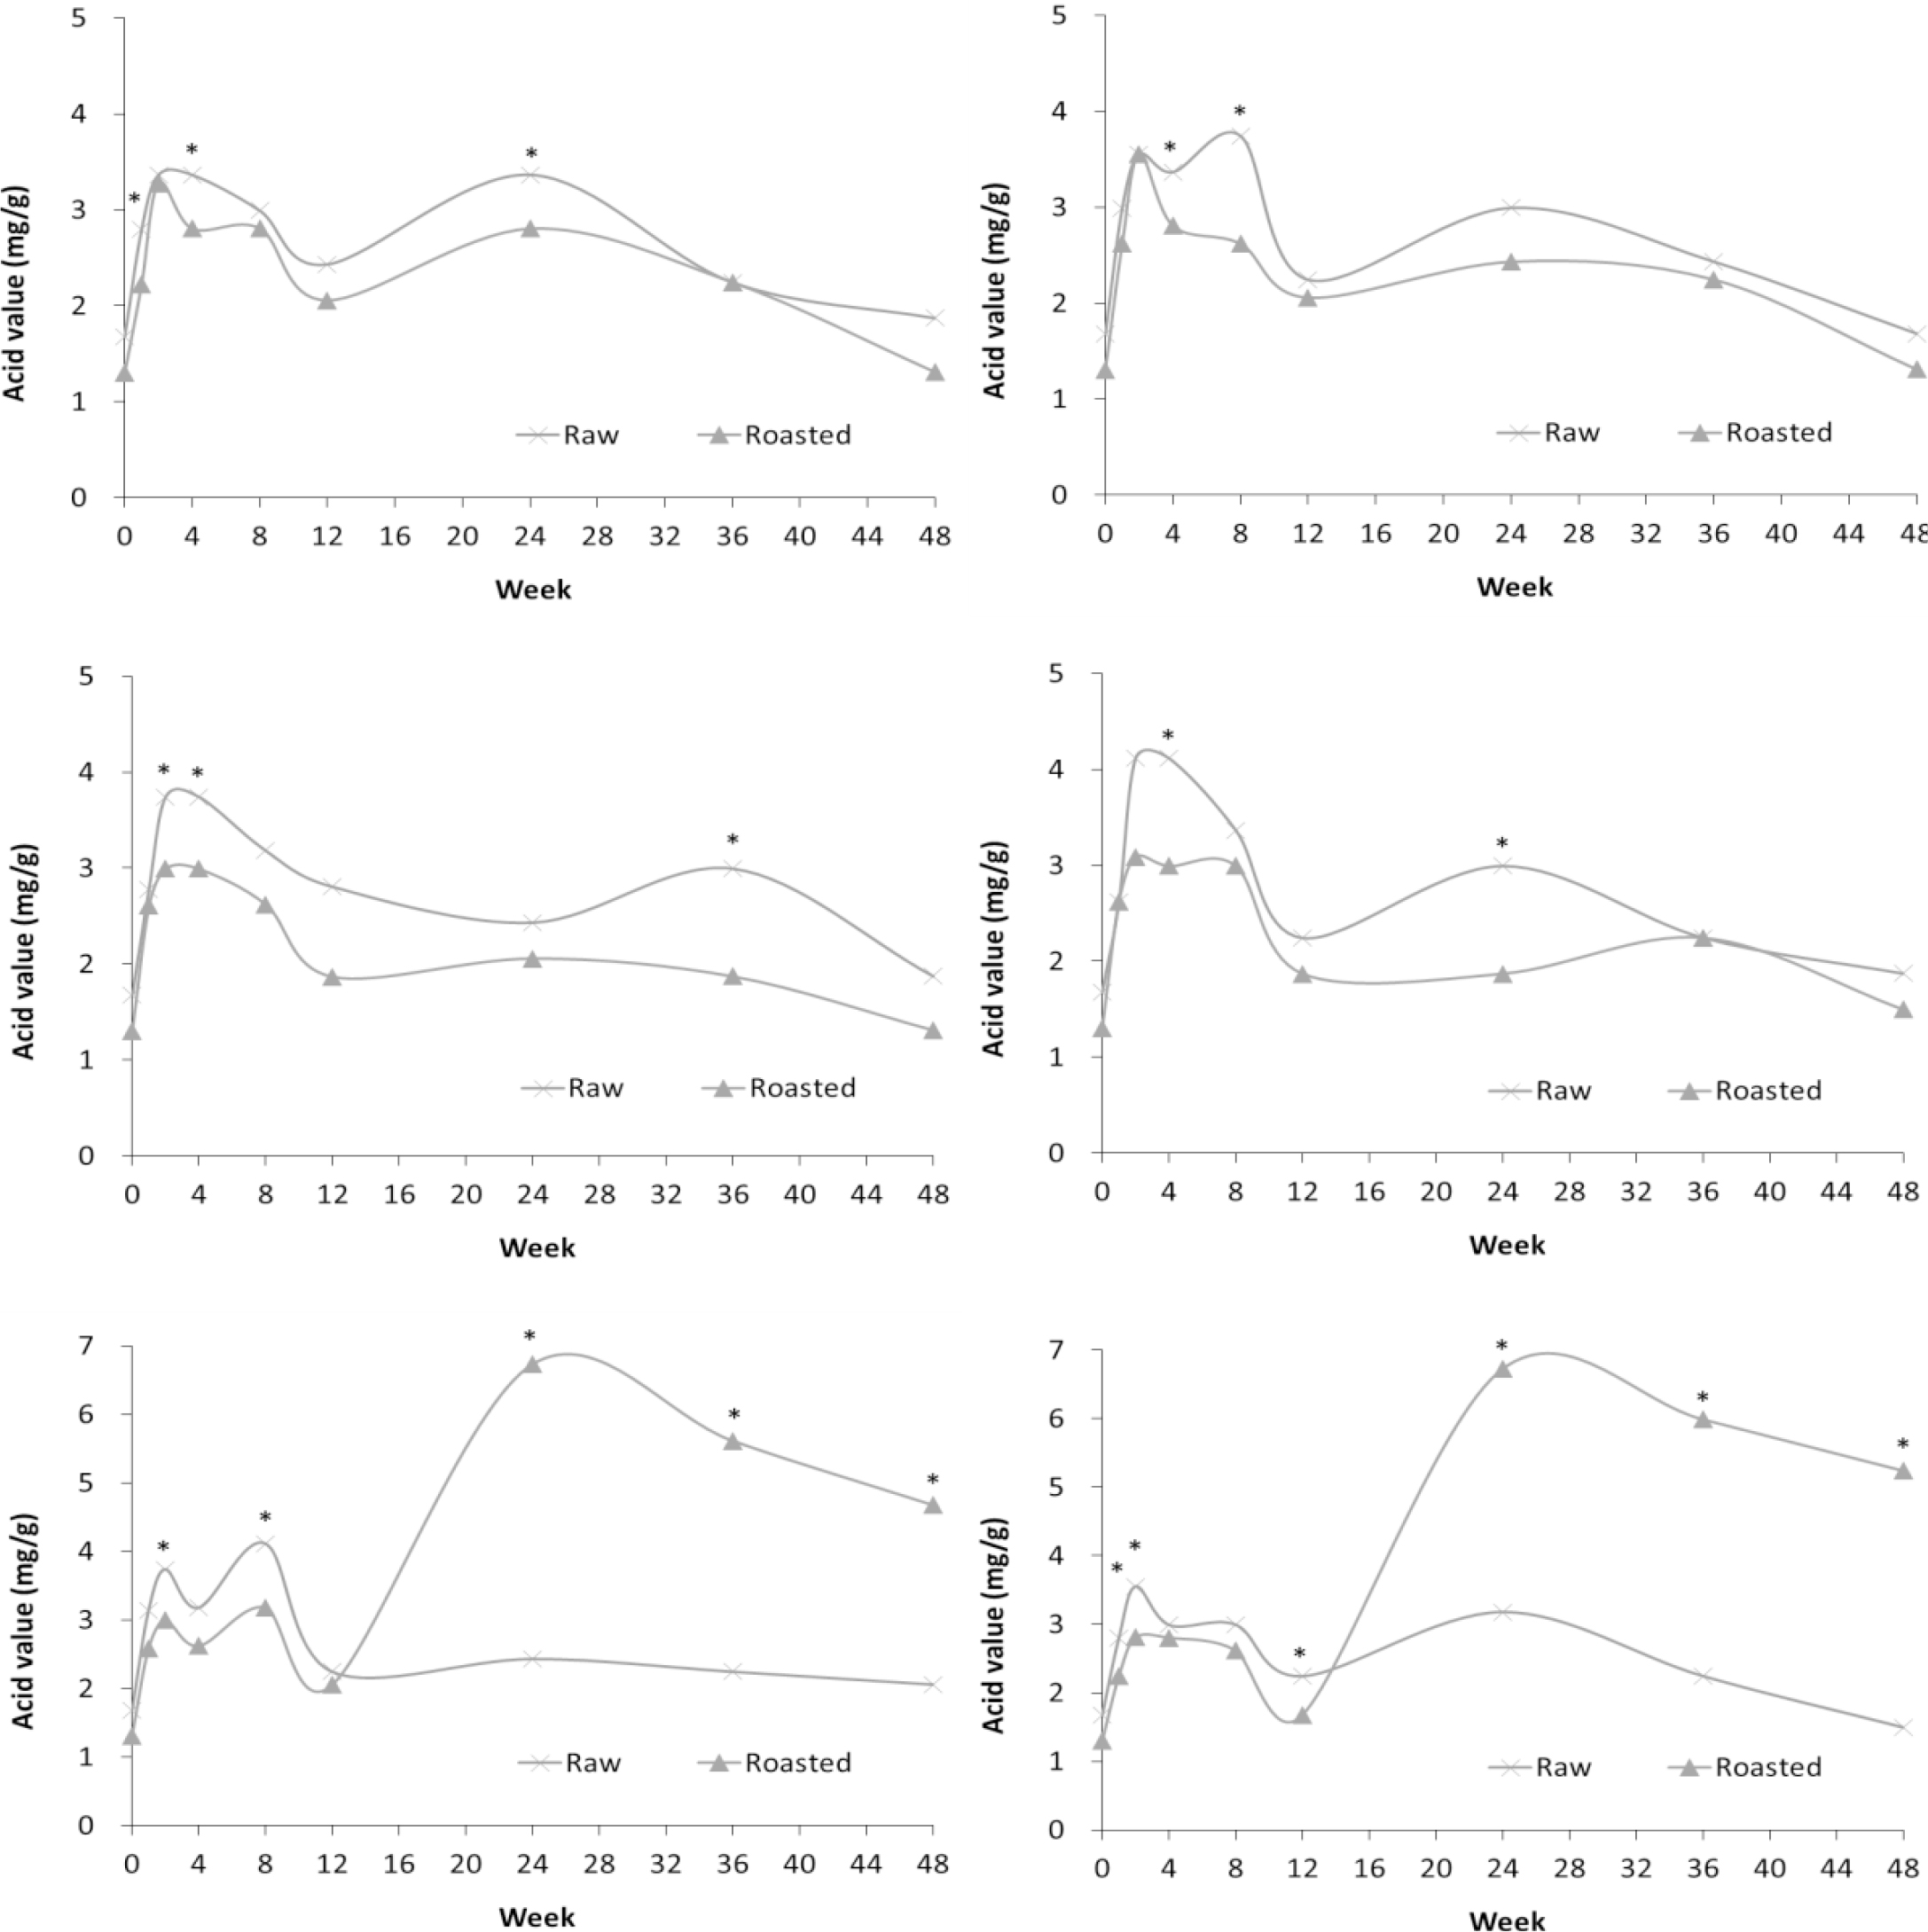
Fig. 4.
Comparison of acid value in RSF and ROSF maintained under different storage conditions. Panels show RSF and ROSF stored in: (A) PE film bags; (B) PPE film bags at RFT; (C) PE film bags; (D) PPE film bags at RT; (E) PE film bags; and (F) PPE film bags at HT. Asterisks (*) denote significant differences in the acid value between RSF and ROSF (p < 0.05).
Under all conditions, the conjugated diene value of both RSF and ROSF tended to increase over time, though the conjugated diene value of ROSF was consistently higher than that of RSF (Fig. 1). Farhoosh reported that, when fried, the conjugated diene values of the frying oils increased through the process. It is suggested that the heat generated by the roasting and grinding process during flour production will affect the eventual rancidity. Notably, the conjugated diene value of ROSF rapidly increased, and then plateaued. This was in agreement with Farhoosh, who stated that the conjugated diene value of all the frying oils reached a stable state after initially increasing.
Under all conditions, the peroxide value of RSF did not show large temporal changes, as opposed to ROSF, as summarized in Fig. 5. In case of ROSF stored at RFT and RT, the peroxide value of ROSF tended to increase beginning 24 weeks, whereas the peroxide value of RSF did not. However, at HT, the peroxide value of ROSF started to increase rapidly at 4 weeks and reached maximum value at 12 weeks. Then, it gradually decreased until 48 weeks. During the heat treatment process, peroxides are decomposed by HT and then new peroxides are formed during cooling. In a previous study, conjugated diene values were not associated with peroxide values because of the decomposition of peroxides at the HT (Farhoosh&Moosavi, 2010). Therefore, peroxide value of ROSF decreased in all conditions from the beginning of storage, and then increased rapidly at HT condition.
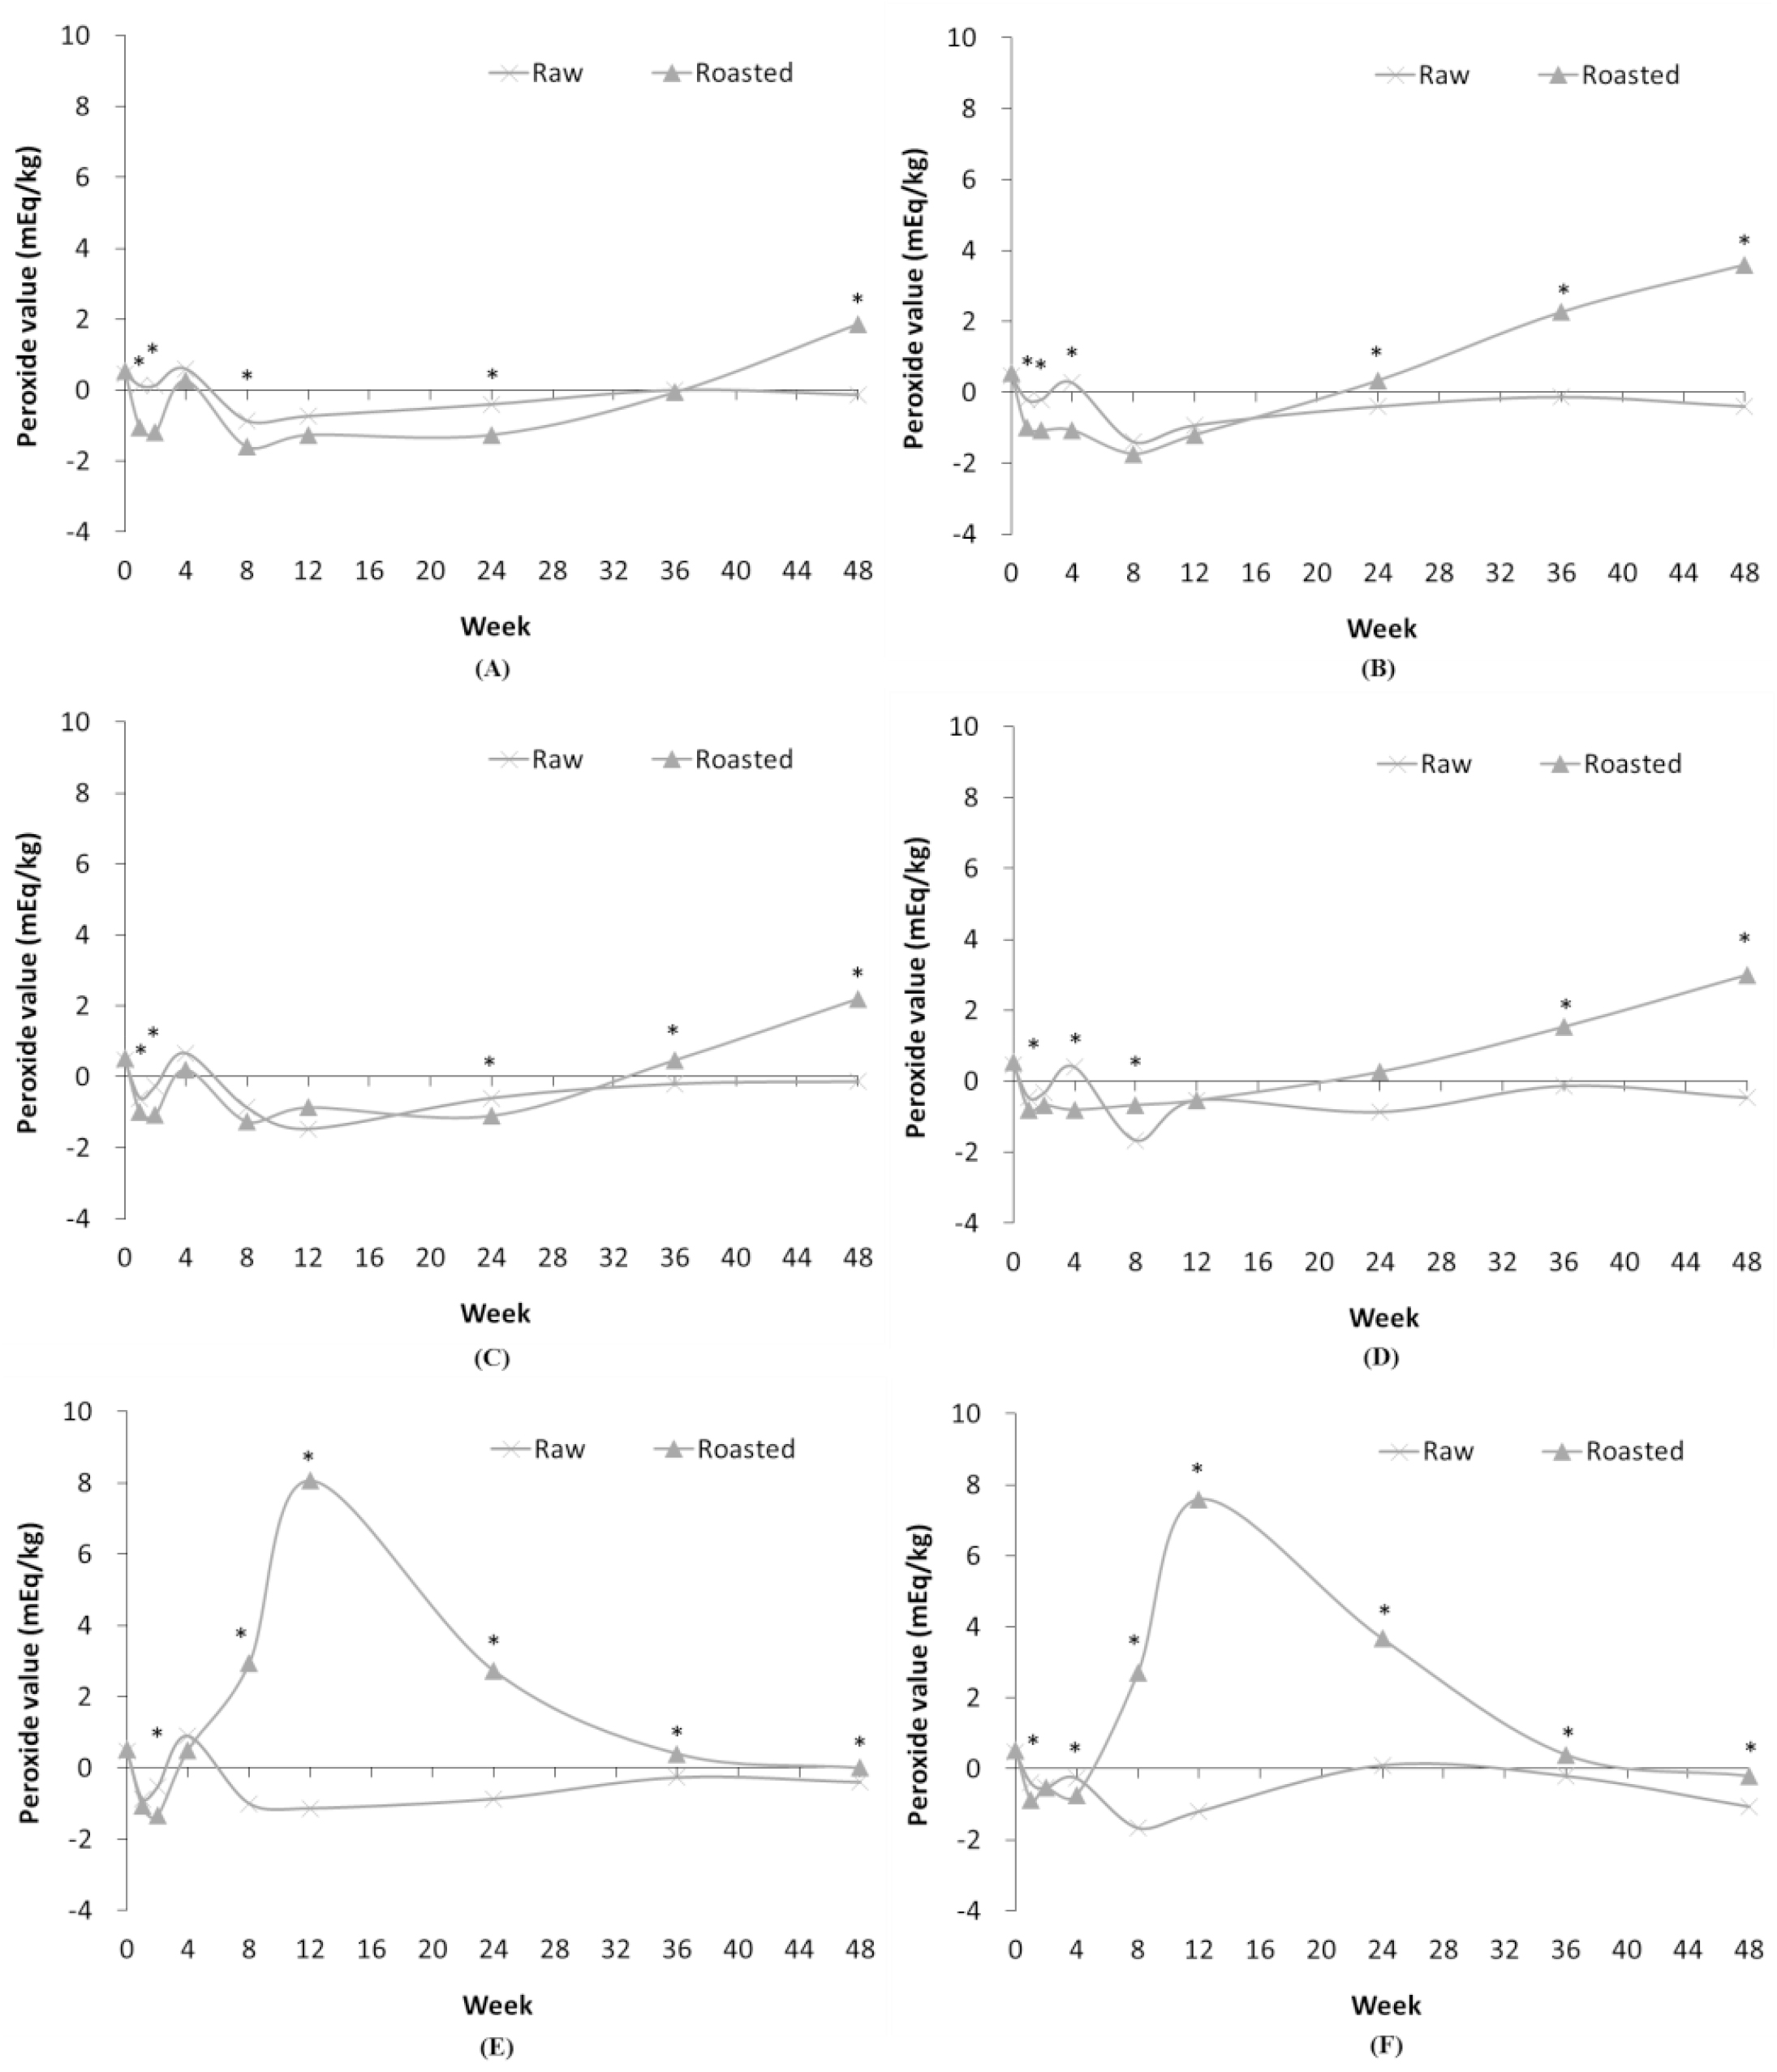
Fig. 5.
Comparison of peroxide value in RSF and ROSF under different storage conditions. Panels show RSF and ROSF stored in: (A) PE film bags and (B) PPE film bags at RFT; (C) PE film bags and (D) PPE film bags at RT; and (E) PE film bags and (F) PPE film bags at HT. Asterisks (*) denote significant differences in the peroxide values between RSF and ROSF (p < 0.05).
In general, the p-anisidine value was higher in ROSF than in RSF, due to the heat treatment occurring during grinding and roasting processes (Fig. 2). When stored at RFT and RT, p-anisidine values of RSF and ROSF exhibited similar temporal patterns. When stored at HT, the p-anisidine value of ROSF was greatest at 24 weeks, and then declined in both PE and PPE film bags. On the contrary, the p-anisidine value of RSF stored at HT reached a maximum at 36 weeks and then decreased. Thus, the rancidity of ROSF was induced earlier than that of RSF because of the heat generated during the roasting and grinding of the SF, and then by storage at HT.
The TBA values of RSF and ROSF differed according to storage period and conditions as represented in Fig. 3. Analysis of the TBA value is relatively less reproducible than that of the peroxide value because of the reaction of the components other than malondialdehyde with 2-TBA (Kim, 1994). Therefore, it was concluded that the variability in TBA values in RSF and ROSF were caused by low reproducibility of the TBA value.
When comparing the lipoxygenase activities of RSF and ROSF, the lipoxygenase activity of ROSF was consistently significantly lower than that of RSF (p<0.05) (Fig. 6). This can be attributed to the fact that heat treatment during the grinding and roasting processes in the flour production affects the enzyme activity (Yemenicioğlu et al., 1998). In case of RSF, the final enzyme activity level is lower than the initial enzyme activity level after 48 weeks in all conditions. The RSF stored at HT conditions shows that the enzyme activity was greatly reduced over time due to the storage temperature. In case of ROSF, there was no significant difference in lipoxygenase activity under all conditions, even after lengthy storage, due to the heat treatment of the grinding and roasting processes.
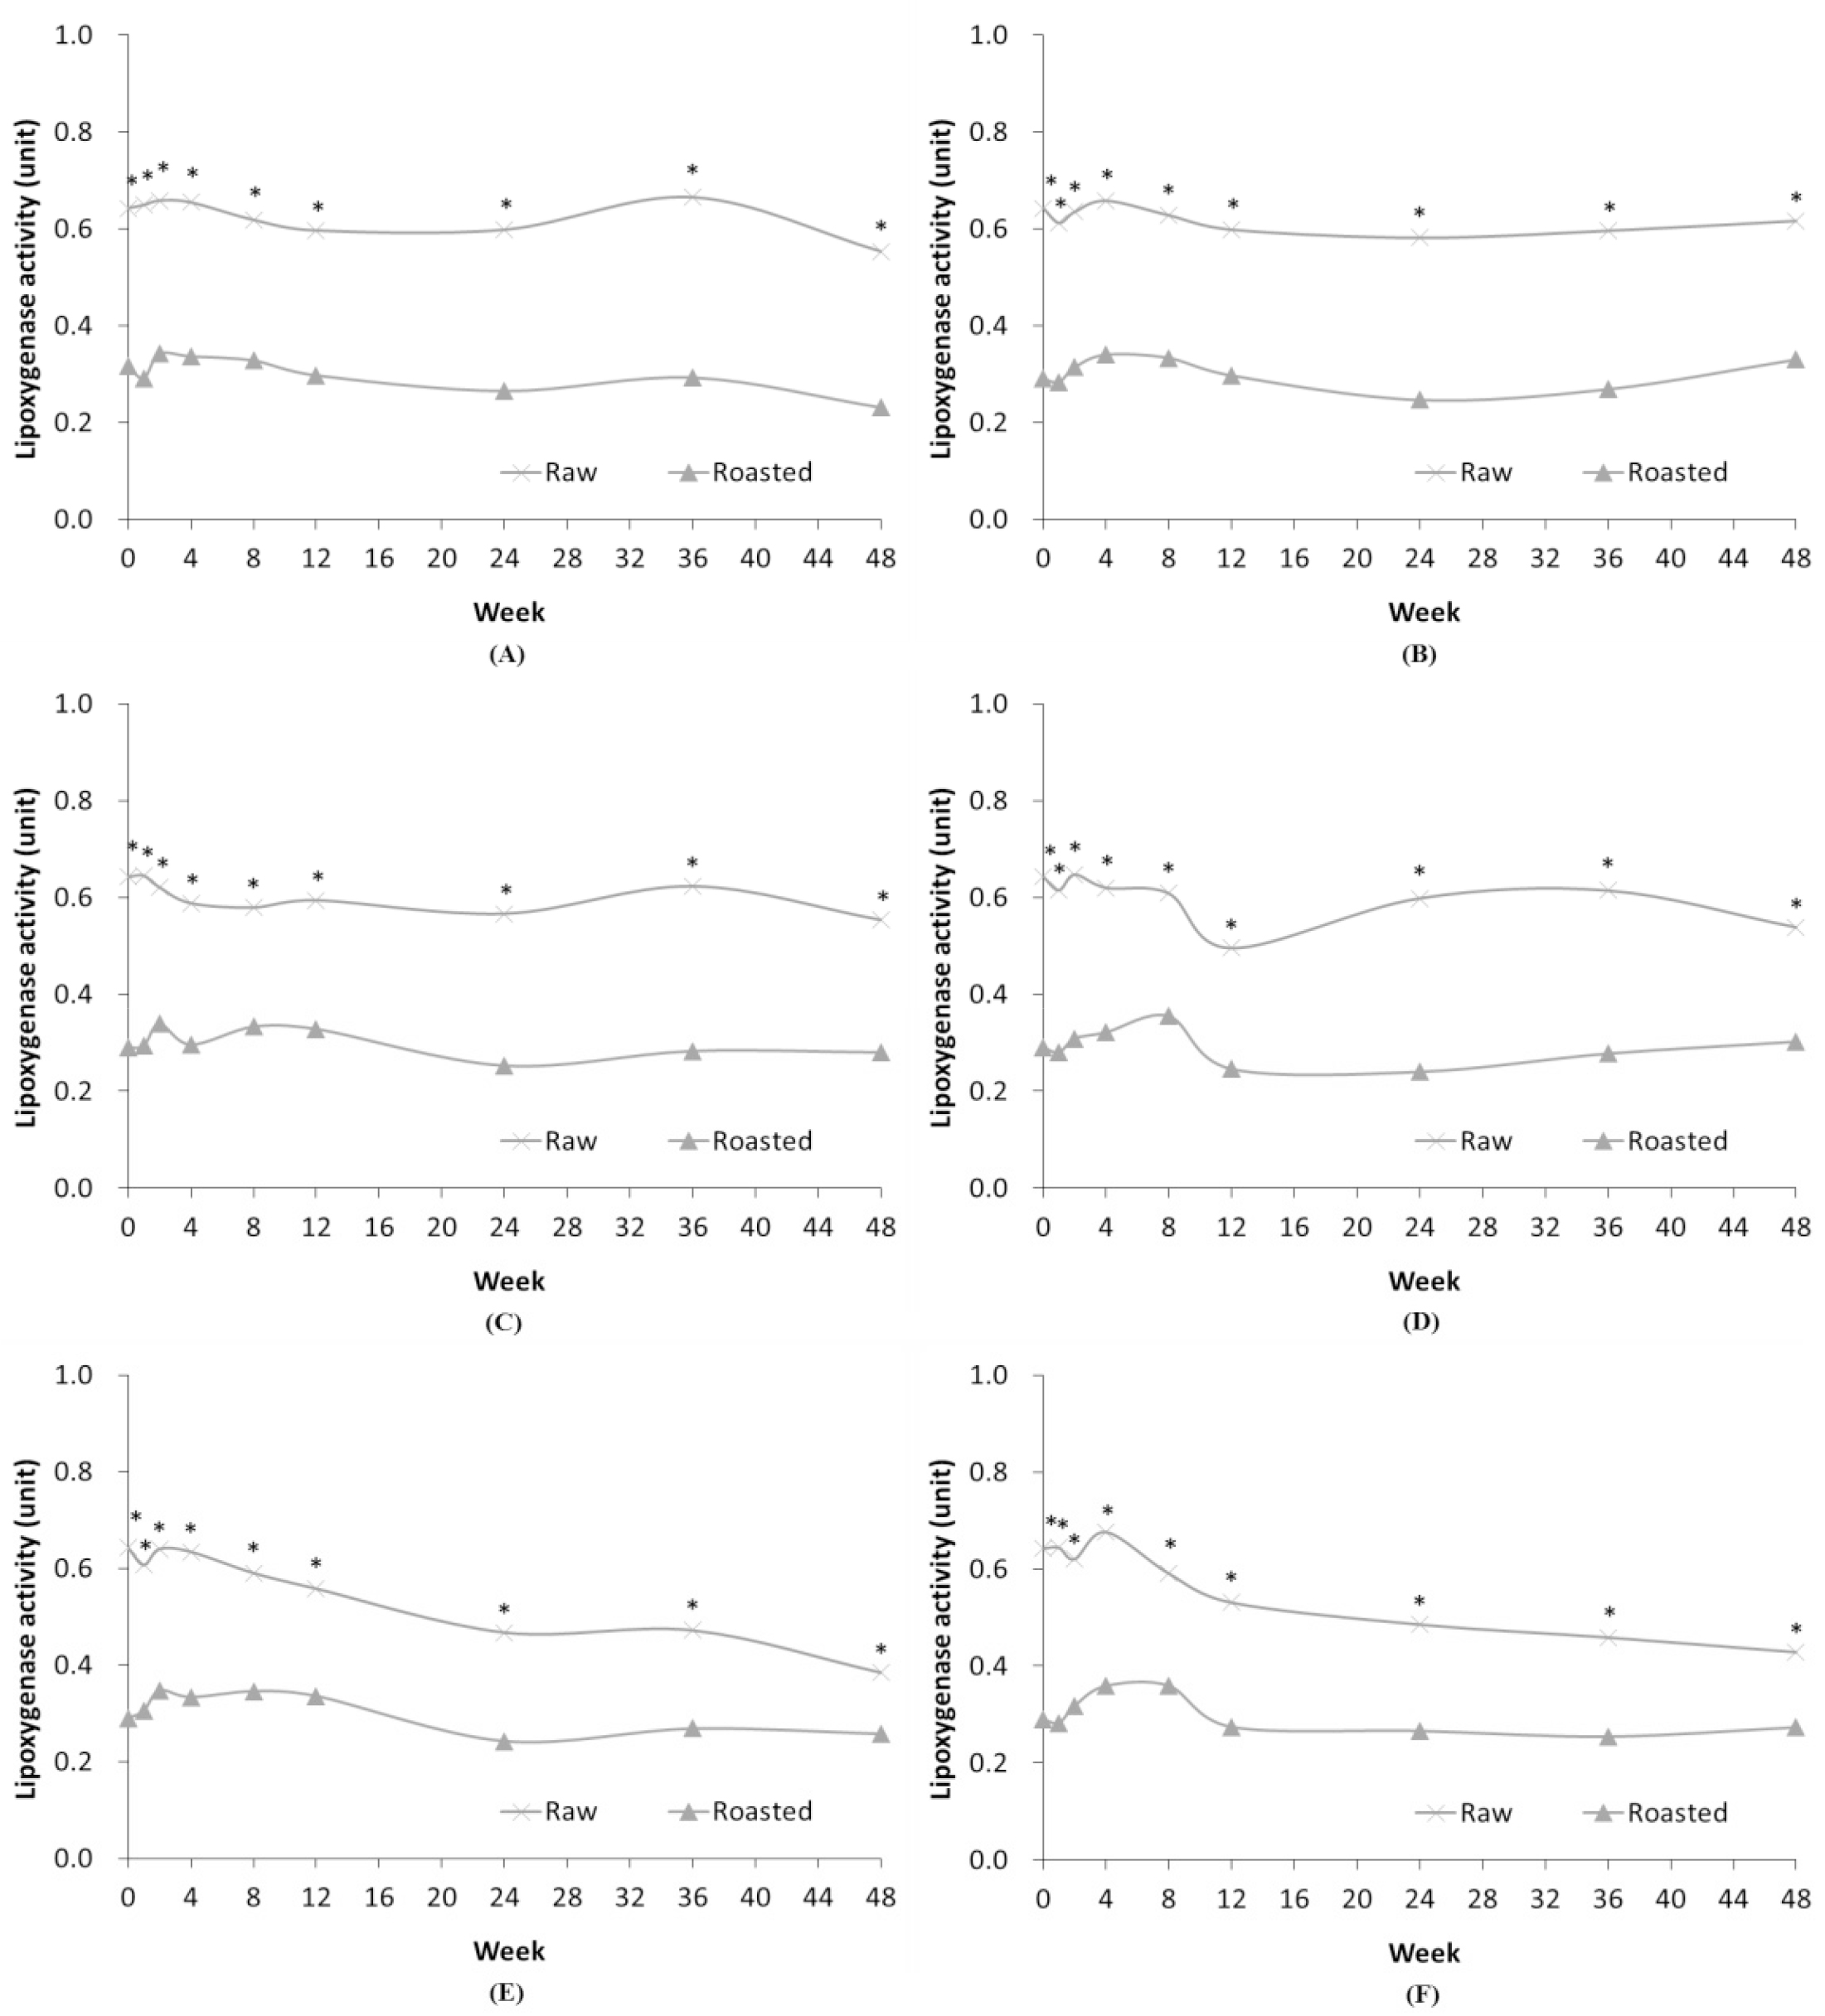
Fig. 6.
Comparison of lipoxygenase activity in RSF and ROSF stored under different conditions. Panels show RSF and ROSF stored in: (A) PE film bags; (B) PPE film bags at RFT; (C) PE film bags; (D) PPE film bags at RT; (E) PE film bags; and (F) PPE film bags at HT. Asterisks (*) denote significant differences in the lipoxygenase activity between RSF and ROSF (p < 0.05).
For RSF, the acid, conjugated diene, and peroxide values showed no significant increase or decrease regardless of the temperature conditions. Thus, it appears that the rancidity reaction does not occur, and stable storage is likely possible for 48 weeks. For ROSF, the increase in peroxide or conjugated diene values at RFT and RT conditions mean that ROSF may be considered stable for storage up to 24 weeks. As the rancidity immediately increases when stored at HT, the ROSF should not be stored at HT to maintain the stability.
Storage stability related to shelf-life for lipids has attracted the attention of many people, including consumers and food processors. Various packaged oils and fats are widely consumed around the world. Several types of plastic films are used for packaging food products. The packaging is beneficial for the extension of shelf life and availability of products for distribution and display. The quality of packaged food is largely determined by the properties of the package, which protect the contents from moisture and oxygen, and the interaction between the packaging materials and food ingredients. Therefore, the main purpose of packaging materials is to minimize factors that affect stability.
The PE film is the most widely used, single polymer food packaging material. The PE film offers a protective barrier against moisture but a poor barrier to oxygen. Thus, food products packed in PE films are susceptible to oxidation. The PPE film is chemically similar to PE film, but with a lower oxygen permeability. Therefore, PPE film is well suited for food packaging. However, oxidation is still a problem (Wessling et al., 1999). This is consistent with other research that showed that low density PE (LDPE) had the higher permeability to oxygen and moisture than PPE. In addition, peanuts stored in PE film bags became more rancid than those stored in PPE film and jute bags. When stored in PPE film, the content of α-tocopherol, an antioxidant that blocks oxidation of food, was significantly lower than when stored in LDPE (Wessling et al., 1999). However, in another study, PPE was found to be more vulnerable to oxidation, which produces many radicals and active intermediaries than PE due to the tertiary carbon and methyl groups.
The PE and PPE film, which are two of the most commonly used plastic packaging materials, were compared in experiments in this study. Of the two materials, PE films makes up 90% of the packaging material currently used in the SF market because they are cheaper and more workable than PPE film. In this study, the degree of oxidation of SF did not differ greatly between packaging materials for most samples. When both packaging materials (PE and PPE) were exposed to oxidative conditions, similar oxidation products (aldehydes, ketones) were produced over time.
Previous reports on the effect of packing material on the self-life of the food products have revealed negative changes leading to degradation of food and quality loss (Siracusa, 2012). A study on milk stored in the naphthalene dominant environment showed increased amount of low density polyethylene contamination in milk during prolonged storage (Lau&Wong, 2000). This stands as evidence to show the influence of storage time on the packing material and food over time. Another studied also showed the degradation of vitamin A and riboflavin in milk stored in polyethylene terephthalate bottles (Zygoura et al., 2004). The polymeric films are well understood for its capability in reducing the antioxidant concentration in food due to the diffusion occurring through polymers surface by evaporation shaking the stability of the food stored (Vermeiren et al., 1999).
The oxidative stability of SF differs slightly between the packaging materials, but it may vary depending on the measurement method of rancidity, so further study on the packaging materials is required. This study provides evidence on the effect of temperature, storage duration, and packing material on the storage stability of SF. In addition, this study can help to develop technology to lower rancidity by adding silica gel or defoamer by providing basic data about the effect of the packaging material on rancidity.
CONCLUSIONS
Through this study, the importance of measuring the rancidity of SF has been proven crucial due to observed changes in acid, conjugated diene, peroxide, p-anisidine, thiobarbituric acid (TBA) values, and lipoxygenase activity, in both RSF and ROSF based on the storage conditions (including temperature) and packing materials. The identification was different for each sample due to various reactions occurring during the procession of SF making and during the period of storage. Changes in stability were observed based on the materials used for packing. Hence, it is important to know the state of the soybean (old or new), storage temperature, and conditions and duration of storage as these factors have notable effects on the primary and secondary compounds produced by the soybean, thus affecting its nutritional value.